Figures & data
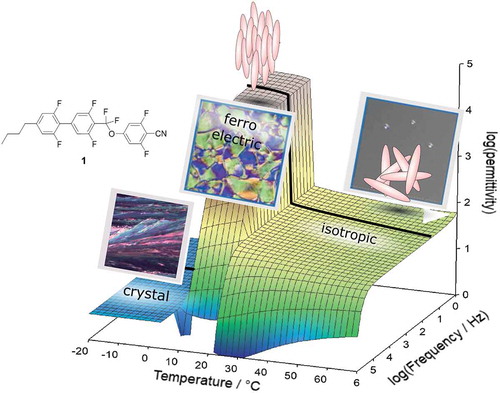
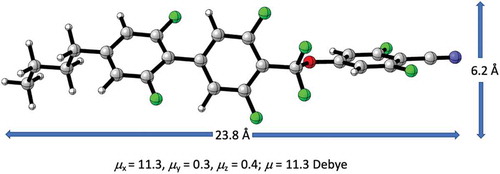
Figure 1. (Colour online) Molecular structure of 1 with calculated molecular dimensions and dipole moment
Scheme 1. Synthesis of 1
Figure 2. (Colour online) DSC of 1 on cooling down
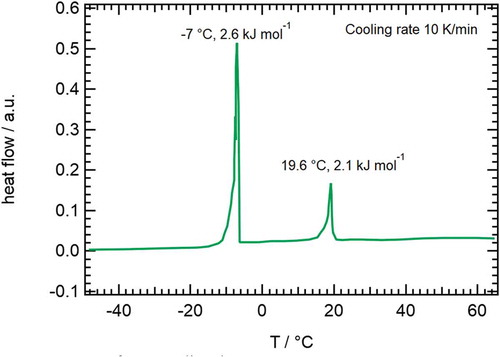
Figure 3. (Colour online) (a-d) (from left to right): Microscopic texture change of 1 upon cooling down from isotropic to ‘nematic’ phase. (a) Appearance of droplets, (b) Growing droplets, (c) Fusing process of droplets, (d) Final quasi-stable ‘nematic’ texture. Images are artificially brightened to optimise texture visibility
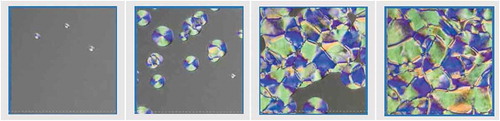
Figure 4. (Colour online) (a-d) (from left to right): Microscopic texture change of 1 upon heating up from the ‘nematic’ to the isotropic phase. (a) Stable ‘nematic’ texture, (b) Appearance of string fine pattern with domain structure maintained, (c) Disappearance of domain structure, (d) New texture with thin needle-like pattern. Images are artificially brightened to optimise texture visibility
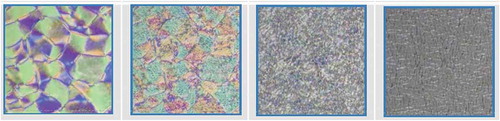
Table 1. Three materials known to exhibit ferroelectric-like nematic phases: Molecular structures, transition temperatures (°C), transition enthalpies (kJ mol−1, in parentheses), molecular length and width (Å) and dipole moments μ (Debye), calculated at B3LYP/6-31G(d). All transitions are estimated on cooling (marked with ↓) except melting from the crystalline phase (marked as ↑)
Figure 5. (Colour online) Full dielectric scans according to experimental details for 110 µm cell gap (left) and 10 µm cell gap (right). Cuts through in the temperature plane for frequencies of 103 Hz, 104 Hz and 105 Hz are also shown. Here, the sharp phase transition is marked with a broken line at 20°C
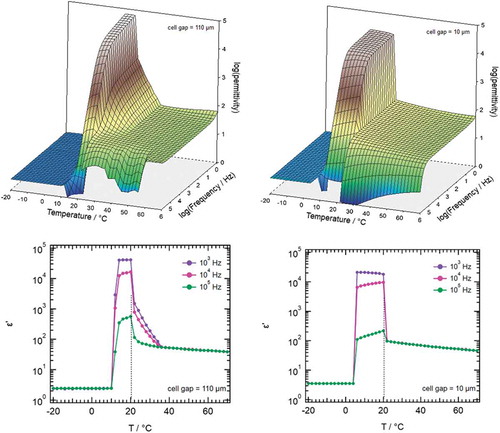
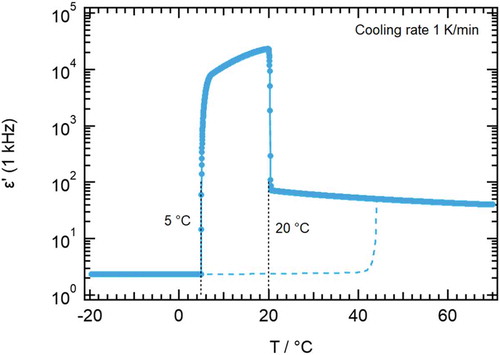
Figure 6. (Colour online) Temperature ramp scan of permittivity according to experimental details for 110 µm cell gap. Full symbols and line show data upon cooling, the broken line shows heating data. The dotted line indicates again the sharp transition into the highly polar phase at 20°C