Figures & data
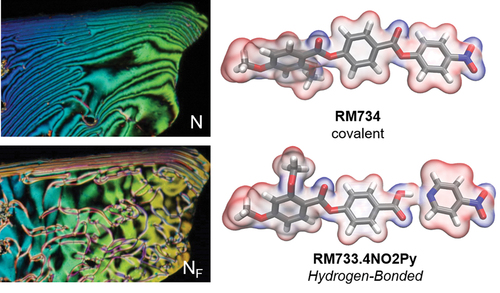
Figure 1. (Colour Online) Programmatically generated cartoon depictions of ellipsoids forming a conventional apolar nematic phase (a) and polar nematic phase (b), with order parameters (<P2>) of 0.60 and 0.67, respectively. (c) Molecular structure and transition temperatures of RM734 and a homologous hydrogen-bonded complex synthesised as part of this work. An idealised polar ellipsoid representation of molecular structure is used elsewhere in this figure, with the red/white/blue colouring used to illustrate regions of electronegativity/electropositivity.
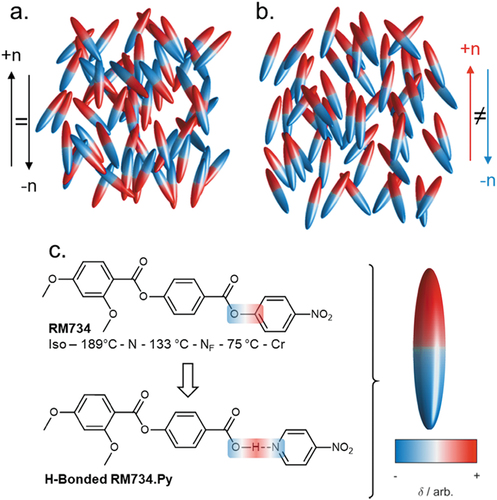
Figure 2. (Colour Online) (a) Synthetic scheme for the synthesis of complexes 1 (Rm733.4npy) and 2 (Rm733.3f4npy), including the MVAC process. Photographs captured during the MVAC process for 2: (b) initial state (complex dissolved in acetone); (c) turbid state (maximum antisolvent concentration reached, complex precipitated); (d) final state (complex redisolved with heating); (e) complex 2 isolated as a colourless microcrystalline solid following suction filtration and drying.
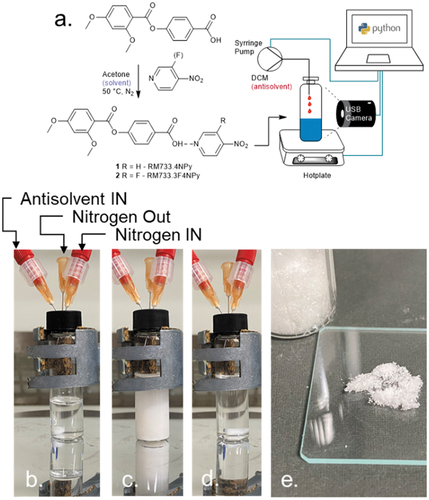
Table 1. Transition temperatures (T, °C) and associated enthalpies (ΔH, kJ mol−1) for the complexes 1 (Rm733.4npy) and 2 (Rm733.3f4npy). Transition temperatures for the analogous parent covalent materials RM734 and RM734-3F are given, above. # Transition observed by POM only. * the complex begins to decompose at 250°C.
Figure 3. (Colour Online) Photomicrographs of complex 1: (a) the schlieren texture of nematic phase at 67°C; (b) at NF-N transition at 45°C; (c) the schlieren texture of the NF phase at 41°C. Photomicrographs a–c are of the same region of the sample, with the scale bar corresponding to 50 µm. Phase diagrams for binary mixtures of: (d) complex 1 and RM734; (e) complex 2 and RM734; note that melting points are omitted for clarity.
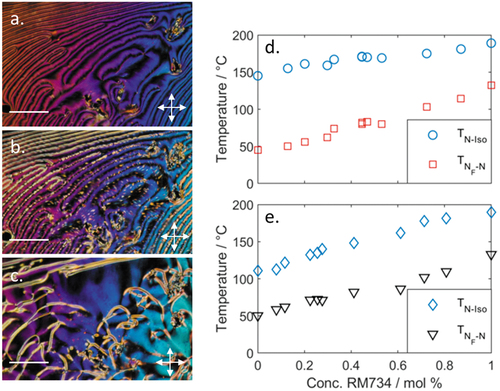
Table 2. Dipole moment (µ, Debye), dipole angle (β, °) and anisotropy of polarizability (Δα, Å3) for complexes 1 and 2, along with the parent covalent materials RM734 and RM734-3F, as calculated at the B3LYP-GD3BJ/6-31 g(d,p) level. Shape Anisotropy Parameter (ShAP) defined here as , where
are the molecular length, width and breadth, respectively.
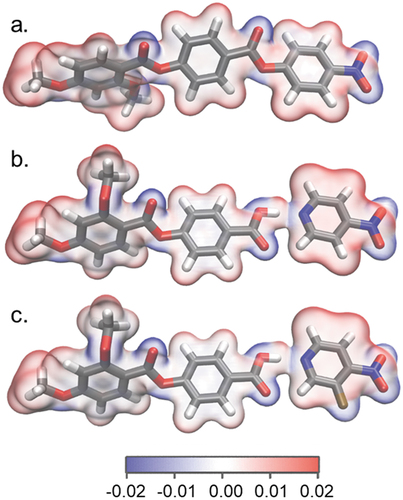
Figure 4. (Colour Online) Optimized geometries of RM734 (a) and complexes 1 (b) and 2 (c) at the B3LYP-GD3BJ/6-31g(d,p) level of DFT, with the electrostatic potential (ESP, isovalue = 0.04 au) on the 0.001 au electron density isosurface.