Figures & data
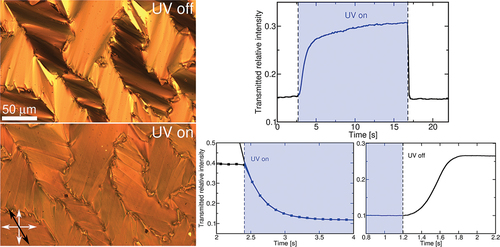
Figure 1. Chemical structure of the investigated compounds with compound (a) having bromine in the central ring and compound (b) having two symetrically positioned chlorine atoms in the central ring.
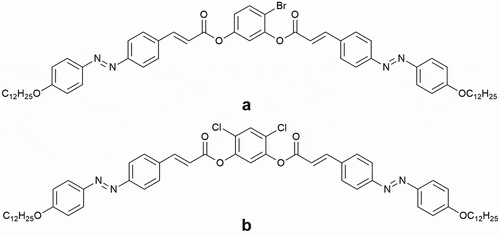
Figure 2. (Colour online) Changes in compound A upon illumination with UV light as seen under a polarising microscope. Top: nematic phase, smectic C at , smectic C at
and smectic C at
with no UV light. Middle: same phases at the same temperatures under UV illumination. Bottom: calculated difference between the non-illuminated and illuminated images depicted as a heat map. Red denotes increased transmittance, blue decreased transmittance and white colour no change. Insets: close-ups of a chosen region of interest. White arrows indicate the orientation of the polarisers and the black arrow the direction of rubbing. Scale bar is
μm.
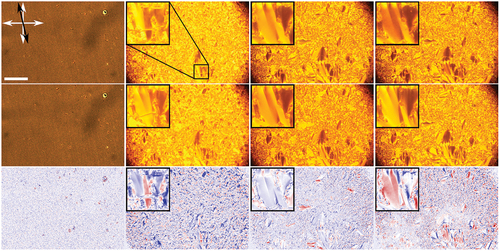
Figure 3. (Colour online) Changes in compound B upon illumination with UV light as seen under a polarising microscope. Top: nematic phase, smectic C at , smectic C at
and smectic C at
with no UV light. Middle: same phases at same temperatures under UV illumination. Bottom: calculated difference between the non-illuminated and illuminated images. Red denoted increased transmittance, blue decreased transmittance and white colour no change. White arrows indicate the orientation of the polarisers and the black arrow the direction of rubbing. Scale bar is
μm.
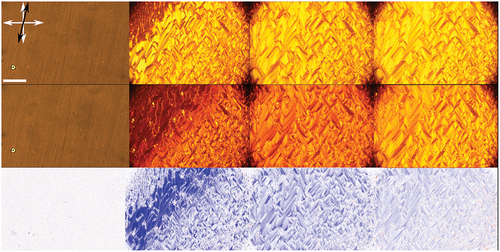
Figure 4. (Colour online) Changes in compound B upon illumination with UV light as seen under a polarising microscope. Top: smectic C with no UV light when the angle between the rubbing direction and the polariser is 30° (left) and 45° (right). Middle: the same sample orientation under UV illumination. Bottom: calculated difference between the non-illuminated and illuminated images. Red denoted increased transmittance, blue decreased transmittance and white colour no change. White arrows indicate the orientation of the polarisers and the black arrow the direction of rubbing. Scale bar is μm.
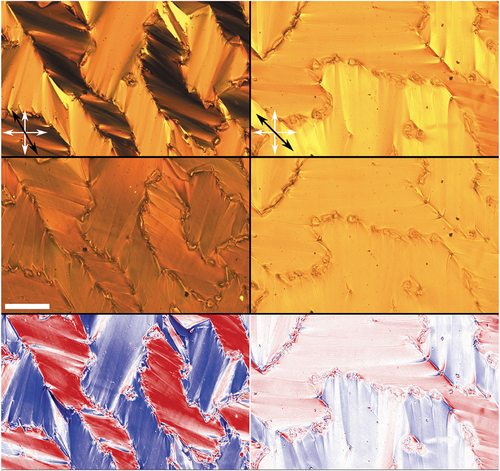
Figure 5. (Colour online) Time dependence of the POM transmitted optical intensity upon switching the UV light on (at ) and off (at
). Different colours represent the transmittance of two chosen regions of interest at rubbing direction angle of 30° with respect to the polariser. Blue lines correspond to a chosen blue region in bottom left and red line to a chosen red region. Switching is shown for two different temperatures: solid line at
and dashed line at
.
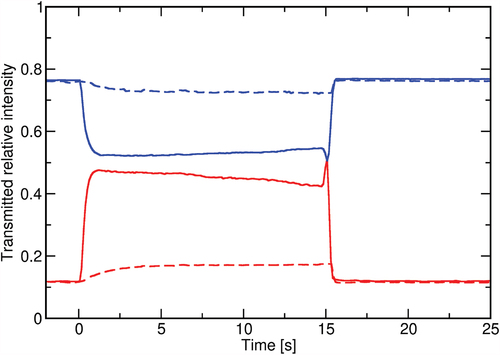
Figure 6. (Colour online) Changes in the transmitted intensity upon UV illumination for sample B at different temperatures. Symbols are the measured data and the solid lines fitted exponential curves, from which the response times were determined. The measurements were shifted to a common initial value for better comparison.
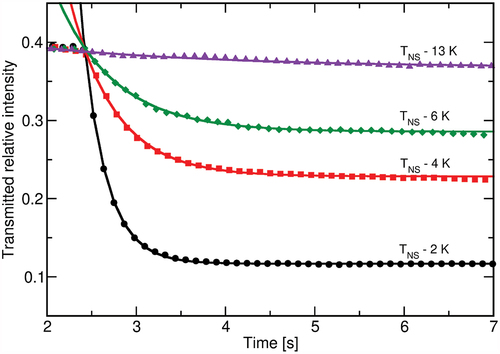
Table 1. Response times upon UV illumination at different temperatures.
Figure 7. (Colour online) Changes in the transmitted intensity upon switching off the UV illumination for sample B at different temperatures. The measurements were shifted to a common final value for better comparison.
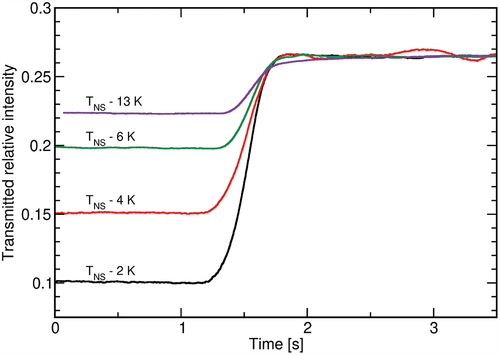
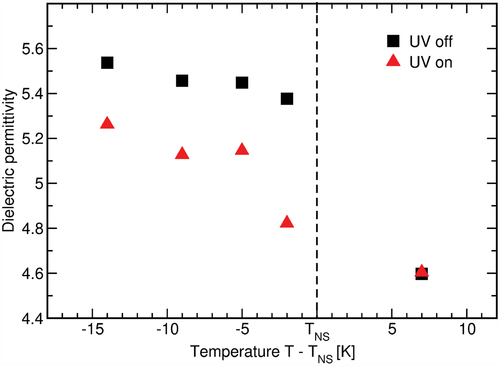
Figure 8. (Colour online) Changes in the dielectric permittivity at upon switching on the UV illumination for sample B at different temperatures.