Figures & data
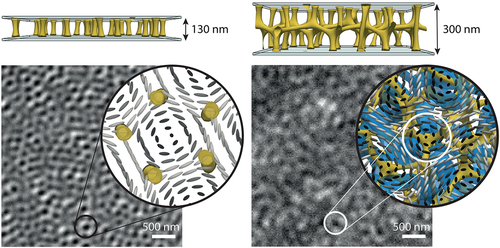
Figure 1. (Colour online) Phase diagram and structure of the blue phases. (a) Temperature – chirality (inverse pitch) phase diagram of chiral nematic exhibiting a critical point . (b)–(d) Numerically calculated structures of BPI, BPII and BPIII, respectively. The blue tubes represent the regions of double-twist cylinders while yellow tubes are the
disclination lines that intertwine them. Note that blue tubes visualise the iso-surface of the DTC. The double-arrows below each panel show an approximate size of the shown structures in units of chiral pitch
. (e) an illustration of a double-twist cylinder, a building block of the blue phases, with a shown cross section. Such a cylinder is equivalent to a quarter-skyrmion. (f) a skyrmion-like cross section of a double-twist cylinder.
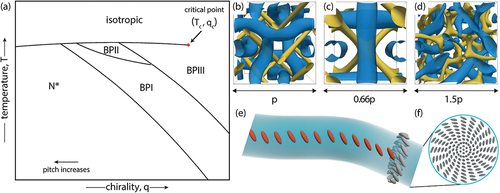
Figure 2. (Colour online) Full and fractional (‘baby’) skyrmions. (a) Polar vector field configuration of a full-skyrmion, with a radial twist equal to and skyrmion number
. (b, c) Structures of half-skyrmion and quarter-skyrmion with
and
radial twist and
and
, respectively. In all cases, the vector mapping of the skyrmion vector field on a unit sphere is shown on the right.
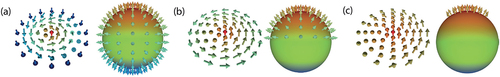
Figure 3. (Colour online) Schematic drawings of skyrmion tubes in CLCs. Full (a), half-(b) and quarter-skyrmion (c) tubes (filaments) found in CLCs. The quarter-skyrmion filament (c) is equivalent of a double-twist cylinder discussed in BP models and presented in .
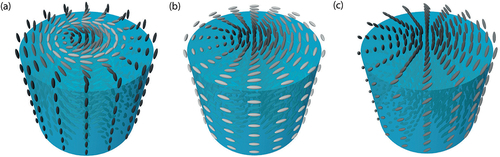
Figure 4. (Colour online) Properties and microscopic appearance of bulk BPIII. (a) Optical rotation as a function of temperature shows a continuous transition to BPIII and a first order transition to BPI. Zero temperature was determined at the onset of optical rotation and was cross calibrated with DLS measurements using 5CB (see ). (b) Reflective spectrum of the sample upon cooling. The spectrum in the amorphous BPIII is wide in the blue part of the visible spectrum shifting to longer wavelengths with reducing temperature. In BPI the spectrum is crystal like, with a sharp peak close to 470 nm. It shifts to
nm upon cooling. Zero temperature was determined at the onset of reflected light intensity on the spectrum. (c) Reflection image of the sample positioned in a temperature gradient cell with temperature ranging from
27°C on the bottom to
30°C on the top, showing three different phases in our sample. Scale bar indicates 10
. (d) Higher resolution microscopic image of BPIII, close to the transition to BPI. Image shows that locally BPIII structure appears similar to half-skyrmion lattices observed in thin layers of BPI; however, it is positionally disordered and dynamic. Scale bar corresponds to 1
. (e) FFT spectrum of an image, averaged over a number of images of the dynamic BPIII showing a ring-like structure. The radius of the ring at
25
corresponds to the typical distance over which intensity is modulated, that is, the distance between the dark spots,
250 nm. Bottom insert shows radially averaged plot of the FFT.
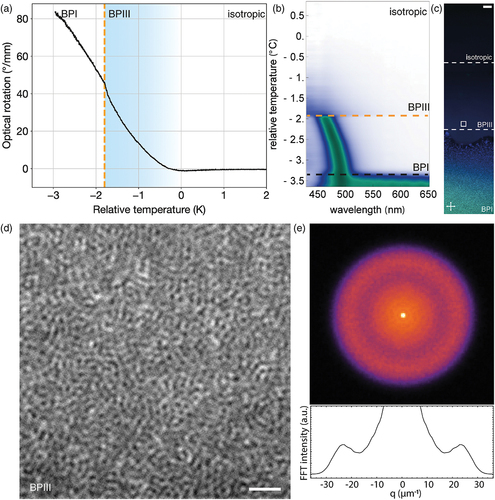
Figure 5. (Colour online) Origin of contrast in BPIII microscopy images. (a) Focus scan of the amorphous BPIII; top row shows images taken at different positions marked by blue colored bands on the lower graph, which shows Image definition dependence on the focus position. Two peaks are observed, corresponding to the two sample-glass interfaces where image contrast is increased. (b)–(e) Image definition dependencies on focus position at different thicknesses with microscopy image shown at the first peak at a point marked with the blue band. Only a single peak could be observed once the sample thickness was below the depth of field determined by the numerical aperture of the objective. Scale bars in images corresponds to 500 nm.
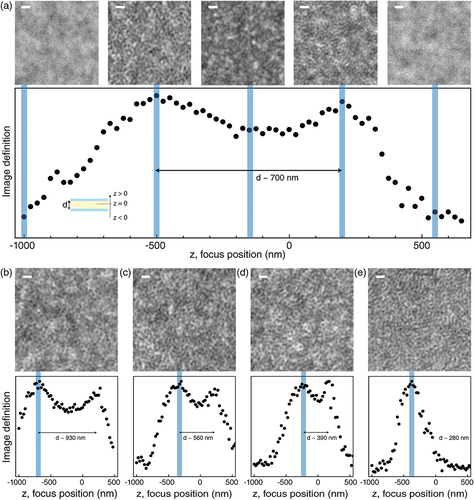
Figure 6. (Colour online) Numerically calculated bulk BPIII structure. The BPIII structure appears as an amorphous mesh of disclination lines with defect cross-section (shown in the bottom insert) and skyrmion filaments with quarter-skyrmion profile shown in the upper circular insert. On the right the director profiles are shown in the plane marked by the two corresponding dark planes on the left figure viewed along the arrow directions.
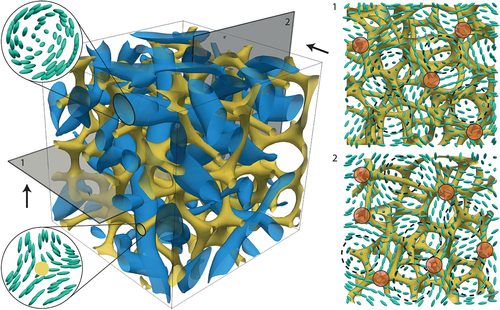
Figure 7. (Colour online) The temperature-thickness phase diagram and thin layer skyrmion structures of BPIII LC. In addition to the chiral nematic phase (E) four different skyrmion phases are observed: isolated half-skyrmions (a), dense half-skyrmions (b), which are quasi two-dimensional structures and the 3D structures blue phase I (d) and blue phase III (c) that form above the critical thickness ob nm. The arrow paths marked with 1, 2 and 3 denote approximate regions for which the results on dynamics in thin layers is presented below. Scale bars in the bottom row images represent 500 nm.
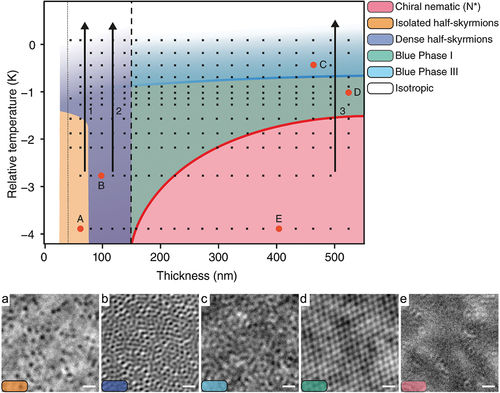
Figure 8. (Colour online) Numerically calculated −1/2 disclination line structures in (a) 130 nm, (b) 230 nm and (c) 300 nm thick simulated cells of BPIII phase from the top (upper row) and side view (lower row). In the thinnest case (a) the disclinations connect vertically between the two plates without horizontal connections. Above the numerical critical thickness, determined around nm, horizontal connections start to form between the disclinations, forming 4 junctions with some disclinations still connecting the two plates directly. In the thickest case (c) the disclination mesh appears completely amorphous. Scale bar corresponds to 100 nm for 270 nm pitch.
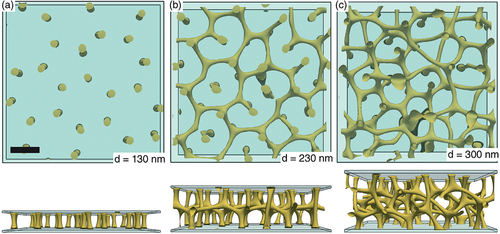
Figure 9. (Colour online) Same structures as in with director structure drawn in the plane near the top glass plate and detected quarter-skyrmions in thicker layers (b,c). In thinnest case (a) the structure is a lattice of half-skyrmions wedged between 5 and 7 vertical disclinations. (b, c) When horizontal disclination connections begin to form the half-skyrmions are replaced by quarter-skyrmion filaments lying obliquely to the surfaces. In all three cases, half-skyrmion director profiles are observed close to the surfaces, above the disclination junctions, with few examples marked with faint-red circles. Scale bar corresponds to 100 nm for 270 nm pitch.
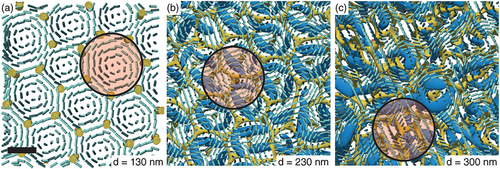
Figure 10. DTMM optical simulations of BPIII skyrmion structures compared with experimental images. Images represent from left to right a structure of isolated half-skyrmions (a), dense half-skyrmions (b) and dynamic BPIII phase (c). Note that all half-skyrmions in (a) and (b) are accompanied by the disclinations (see ) but their size and distance to the half-skyrmion are below the resolution limit of our system. Scale bar marked on (a) corresponds to 500 nm on all images.
Figure 11. (Colour online) Comparison of microscopic images taken with right- (top) and left-handed (bottom) circularly polarised light with simulated images. Three different structures are shown from left to right: isolated half-skyrmions at a low temperature and thickness nm, dense half-skyrmions at a low temperature and
nm and a snapshot of a dynamic BPIII phase at a thickness of
nm. Scale bar represents
nm for both experimental and numerical images. The blue and red circular arrows indicate the direction of light electric field
rotation with respect to the light travel direction (yellow arrow) in RHC and LHC case, respectively.
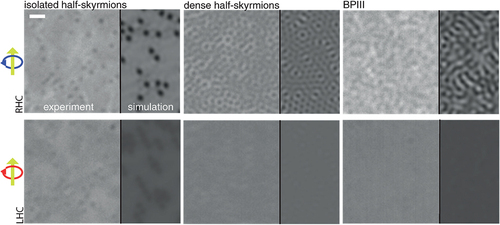
Figure 12. (Colour online) Dynamic light scattering measurements in bulk BPIII. (a) Temperature dependency of the relaxation frequency as a function of temperature upon cooling from the isotropic phase. In BPIII phase, another slower mode appears (blue) and continues slowing down at a similar rate as the faster mode (red) until BPI is reached. Black curve is the optical rotation measurement on the same temperature scale, calibrated using the NI transition temperature of a 5CB sample. In the top row, snapshots of BPIII inside a cell at different temperatures in the BPIII phase marked schematically on the DLS graph. Images are scaled to same intensity range and the scale bars denote 500 nm. (b) Comparison of measurements using LHC and RHC light. Upper graph shown the relative amplitude of the slow mode, appearing in BPIII, for LHC/LHC (black) and RHC/RHC (red) configurations. The bottom temperature dependence shows the relaxation frequency of the fast mode in both polarisation configurations from the high temperature isotropic phase to the transition.
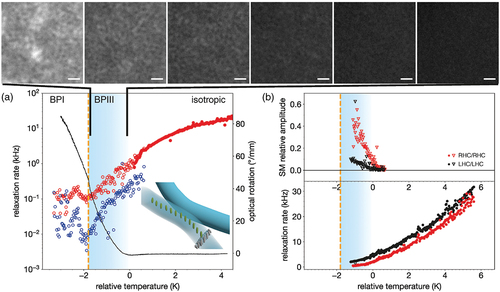
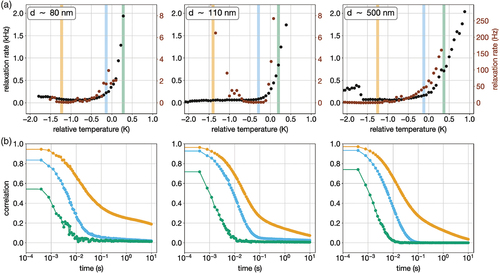
Figure 13. (Colour online) Dynamics in thin BPIII layers. (a) Temperature dependency of the slow and fast relaxation measured in 80, 110 and 500 nm thick cells from left to right, measured along the marked vertical lines in the phase diagram of . (b) Selected correlation functions at corresponding thicknesses measured at three different temperatures marked in (a). We see that a slow decaying tail form at the at intermediate temperatures, marked with blue, a consequence of long lived half-skyrmions. Zeroes of the relative temperatures are determined by extrapolating the linear slowing down of the fast mode frequency near the isotropic phase to zero.