
Figures & data
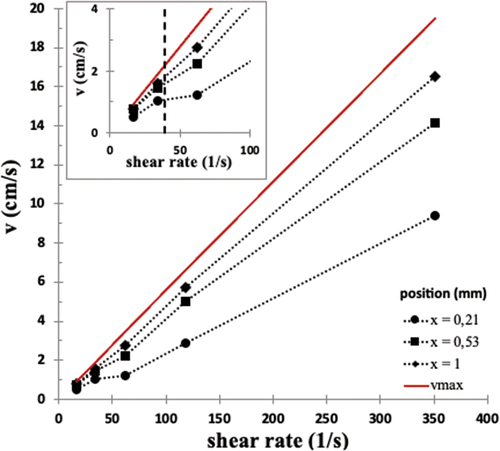
Figure 1. (Colour online) Schematic diagram of: (a) the arrangement of magnetic fields used for NMR spectroscopy and microimaging; (b) the Couette cell used inside the standard Bruker micro-imaging gradient system Micro 2.5 for rheo-NMR analysis. The Couette cell consists of two coaxial cylinders having a gap of 1 mm between them, both made of PEEK, being the symmetry axis parallel to the magnetic field direction. The mechanical motion in the device originates from a pulse-programmer-controlled stepper motor placed on the top of the magnet.
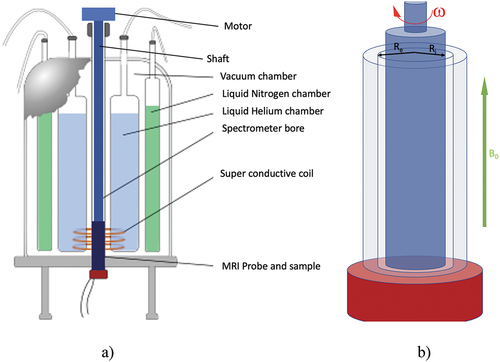
Figure 2. Representative results of the velocity profiles spectra for the 17% PBLG/m-cresol solution: at shear rates: (a) 33,93 and (b) 118,75 s−1, at T = 30°C. Where x = 0 and x = 1 mm correspond respectively to the inner wall of the static outer cylinder and to the outer wall of the rotating inner cylinder positions.
Figure 3. Linear velocity as a function of gap position for the 17% PBLG/m-cresol solution, for several shear rates, at T = 30 ºC. Where x = 0 and x = 1 mm correspond respectively to the inner wall of the static outer cylinder and to the outer wall of the rotating inner cylinder positions.
Figure 4. (Colour online) Velocity as a function of shear rate for 17% PBLG/m-cresol solution, at T = 30°C, plotted for three different positions along the radial direction at x = 0,21; 0,53 and 1 mm. Inset: zoom-in at low shear rate range, showing the behaviour transition observed in the velocity profile that occurs at a shear rate of ~40 s−1, identified by the dashed vertical line.

Table 1. Viscosity coefficients determined for 17% PBLG/m-cresol [Citation10].