Figures & data
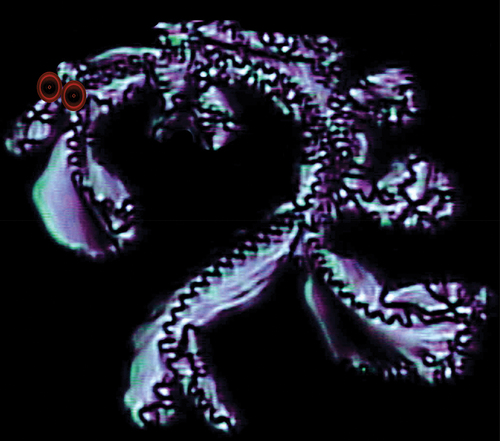
Figure 1. Structures of bimesogens possessing silyloxy central connecting groups. Bimesogen I has been reported to exhibit an antiferroelectric smectic CA* phase, whereas bimesogens II are the focus of this article.
Figure 2. The structural designs of the bimesogens targeted for preparation.
Scheme 1. Pathway to the syntheses of six dimers 2a(3, 8, 9) and 2b(3, 8, 9).
Table 1. Transition temperature (°C) and associated enthalpies [kJ mol−1] for the bimesogens determined by POM and DSC.
Figure 3. (Colour online) Potential synclinic (a) and anticlinic (b) nanosegregated molecular layered structures of the smectic C phases of bimesogens, and the potential interdigitated synclinic intercalated structures of a smectic Cd phase of a bimesogen.
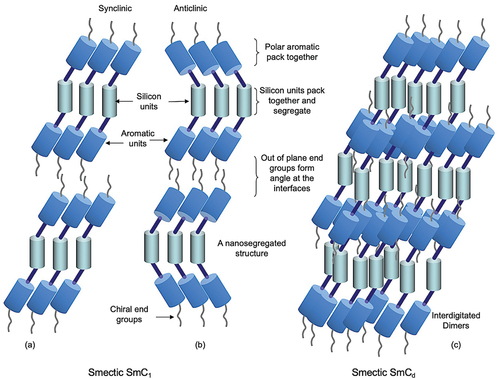
Figure 4. (Colour online) Minimum energy conformations for molecules of the bimesogen 2a3, modelled using Chem3D from Cambridge scientific, and DFT theory at the MO62-X/6-31 G level of theory.
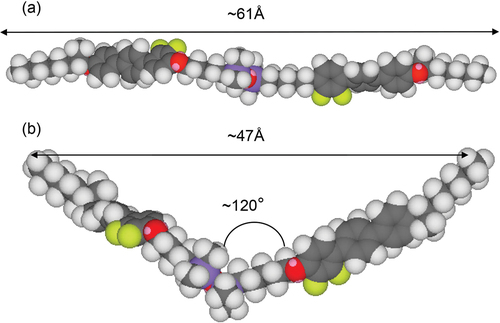
Figure 5. (Colour online) (a) 2-D powder diffraction patterns in each phase of matter, and (b) diffraction profiles as a function of temperature for bimesogen 2a3.
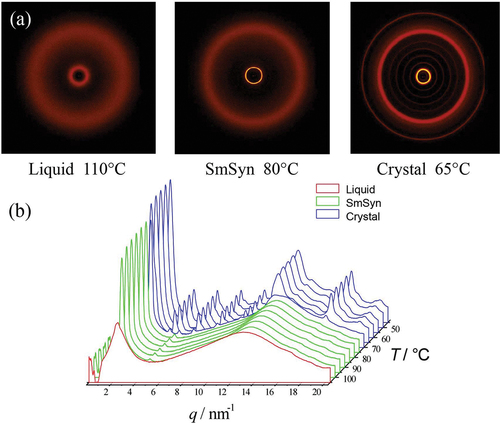
Figure 6. (Colour online) (a) 2-D powder diffraction patterns in each phase of matter, and (b) diffraction profile as a function of temperature for bimesogen 2b3.
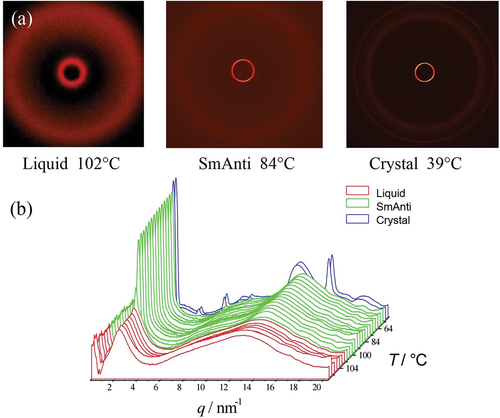
Figure 7. (Colour online) (a) 2-D Powder diffraction patterns in each phase of matter, (b) diffraction profiles as a function of temperature for bimesogen 2b8.
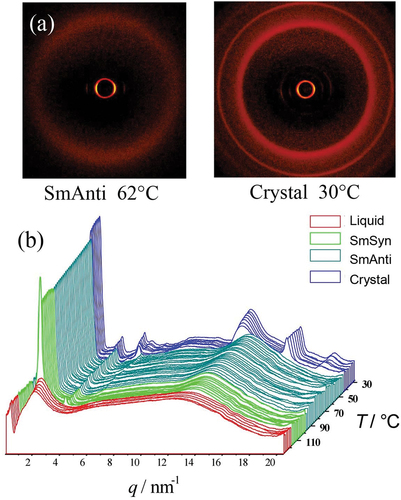
Figure 8. (Colour online) Expanded graph of the layer spacing in the synclinic and anticlinic phases as a function of temperature (°C) for bimesogen 2b8.
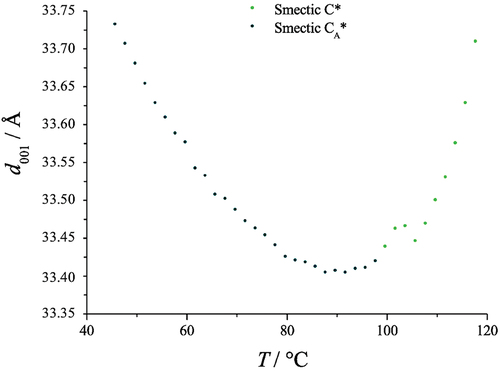
Figure 9. (Colour online) (a) 2-D powder diffraction patterns in each phase of matter, and (b) diffraction profiles as a function of temperature for bimesogen 2b9.
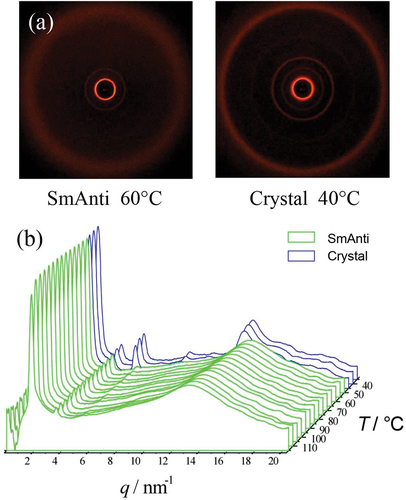
Figure 10. (Colour online) Values of the layer spacings, d, as a function of change in temperature for all four bimesogens.
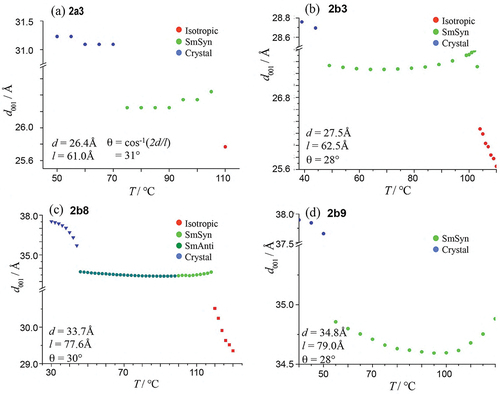
Figure 11. (Colour online) Spontaneous polarisation (nC cm−2) measured as a function of the reduced temperature for bimesogens (a) 2a(3, 8, and 9), and (b) 2b(8 and 9).
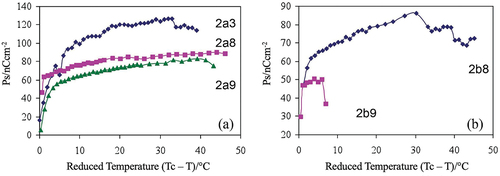
Figure 12. (Colour online) Switching profiles for bimesogen 2b8, (a) at a temperature of 114.5°C and a frequency of 100 mHz, and (b) at a temperature of 113.5°C and a frequency of 50 mHz.
Figure 13. (Colour online) Tilt angle (°) as a function of the reduced temperature for bimesogens (a) 2a(3, 8, and 9), and (b) 2b(8 and 9).
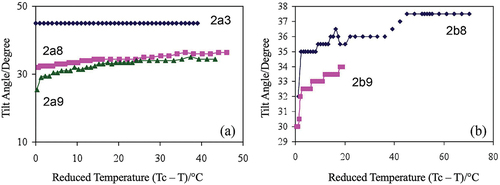
Figure 14. (Colour online) Proposed conformations and nanosegregation of the molecules in the synclinic and anticlinic phases of the bimesogens.
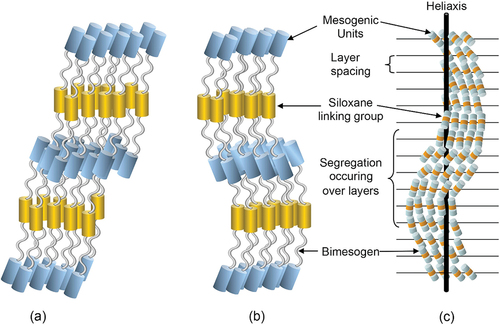
Figure 15. (Colour online) Snapshots taken from the MD simulations of synclinic 2a3 at 363 K (a and b) and anticlinic 2b3 at 359 K (c and d) with terphenyls interdigitated (a and c) and only terminal alkyl chains interdigitated (b and d), and showing approximately five selected layers from the centres of the full simulation boxes. Siloxane moieties are shown in yellow, terphenyls in cyan, terminal alkyl chains in grey, and internal alkyl chains in black. The layer spacings shown are for illustration, with the d values having been determined from a full analysis when calculating the respective τ values, and as listed in .
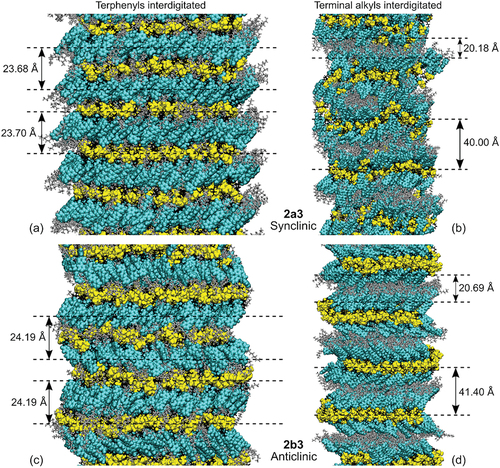
Table 2. Values of positional order parameters (τs and τt) and layer spacings (ds and dt) determined from the MD simulations and averaged over the final 100 ns.
Figure 16. (Colour online) Defect textures formed on cooling from the isotropic liquid for bimesogens 2a3 (a) and 2b3 (b).
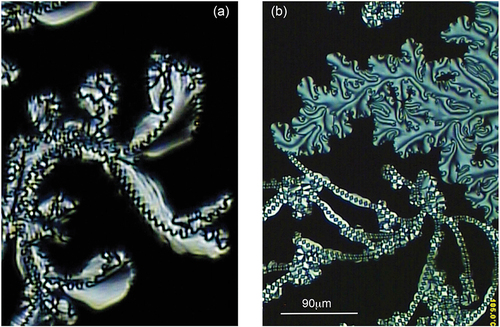
Figure 17. (Colour online) Defect textures exhibited by bimesogen 2b3 and 2b8. (a) Shows the schlieren texture of 2b3 where the defects in the left circle are possibly mixed disperations of s = 3/2, the centre circle possesses a s = ½ disperation, and the right circle a s = 1 singularity (x125). (b) a conical defect texture of 2b8 in the anticlinic phase showing parallel pitch lines, which are linked to a helical structure (x125).
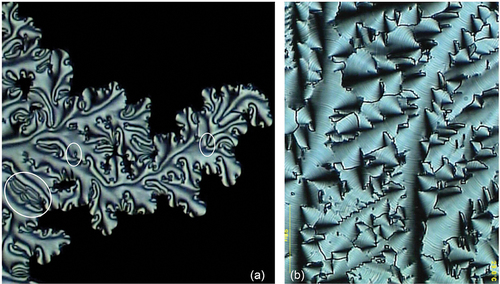
Figure 18. (Colour online) (a) Growth of the filaments of bimesogen 2b3 as they form from the isotropic liquid (x125), (b) a black/white blow-up of the central region of (a), showing growth around the central axis of a filament.
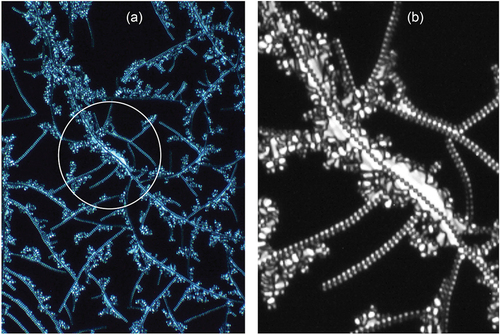
Figure 19. (Colour online) (a) A colour inverted and black/white expansion of . (b) An expansion of the central filament in . The black lines are to emphasise the dark lines along the centre of the filament.
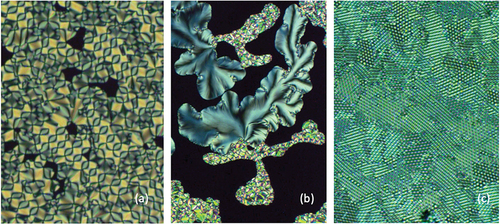
Figure 20. (Colour online) (a) Looped defect texture of dimer 2a3 at 78 °C, (b) schlieren and looped texture shown together for 2a3, and (c) the hexagonal periodic defect texture of 2a3, all at x100 magnification.