Figures & data
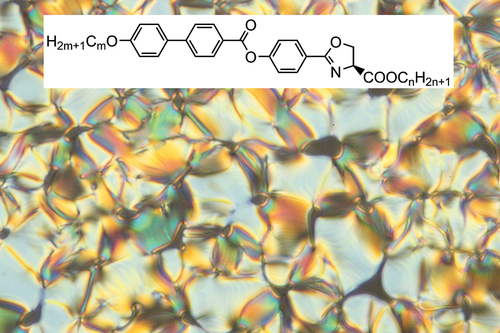
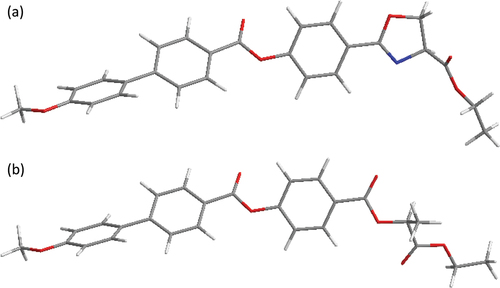
Figure 1. Molecular structure of a) the studied compounds OXm/n, bearing a chiral oxazoline α-carboxylic acid as a source of chirality and b) the previously reported lactic acid derivatives ZLm/n [Citation18].
![Figure 1. Molecular structure of a) the studied compounds OXm/n, bearing a chiral oxazoline α-carboxylic acid as a source of chirality and b) the previously reported lactic acid derivatives ZLm/n [Citation18].](/cms/asset/608cdce0-07a7-450a-bf98-e353340d0e98/tlct_a_2252388_f0001_b.gif)
Scheme 1. Synthesis of chiral oxazolines OXm/n.
Figure 2. The HPLC chromatograms of the enantioseparation of OXm/n products with denoted enantiomers. Column Chiralpak IA, mobile phase n-hexane/dichloromethane/2-propanol 70/28/2 (v/v/v), temperature 20°C.
Figure 3. (Colour online) DSC thermographs for compounds (a) OX10/6 and (b) OX6/10, taken on the second heating (red colour) and cooling (blue colour) runs.
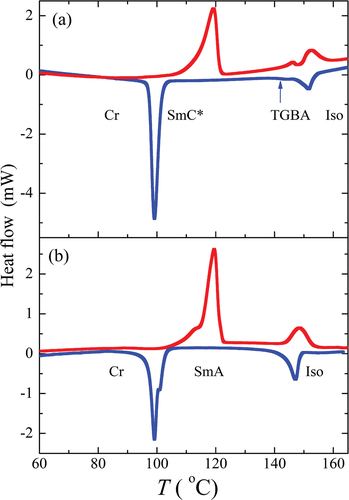
Figure 4. (Colour online) Textures of the studied compound OX10/6, obtained from POM: (a) at the isotropic-TGBA phase transition at T = 149°C, (b) in the TGBA phase at T = 147°C, (c) in the TGBA phase at T = 143°C and (d) in the SmC* phase at T = 138°C. The width of the photos corresponds to about 300 µm.
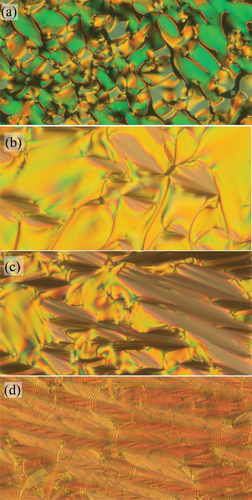
Table 1. Mesomorphic properties of the studied OXm/n compounds: melting point, m.p., the phase transition temperatures, Ttr (in oC), and enthalpy changes, ΔH (in kJ/mol), are taken from the differential scanning calorimetry (DSC) measurements, second heating and cooling runs.
Figure 5. (Colour online) The temperature dependence of the spontaneous polarisation (■) and tilt angle (●) for OX10/6 material in the ferroelectric SmC* phase.
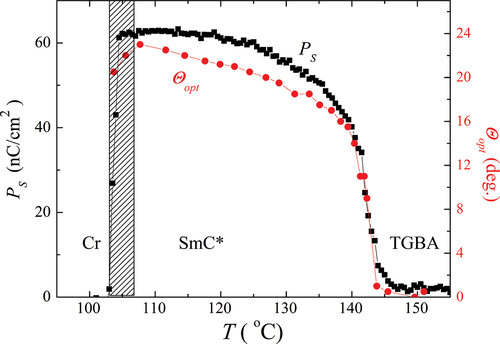
Figure 6. The temperature dependence of the helical pitch, p, for OX10/6 material in the ferroelectric SmC* phase.
Figure 7. (Colour online) The temperature dependence of the layer thickness (■) and the intensity of the scattered signal or the full width at half maximum values (□), obtained from the X-ray diffraction measurements for a) OX10/6; b) OX 6/10 and c) OX12/10 compounds. Dashed areas between the phases mark the coexistence regions.
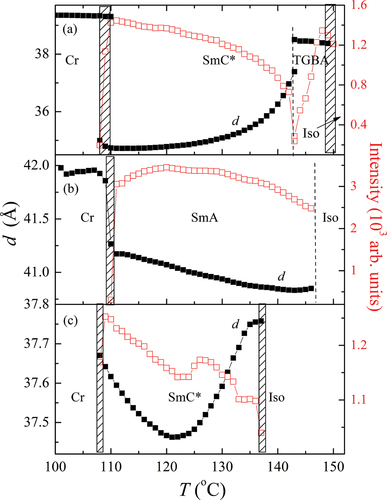
Figure 8. Comparison of the molecular tilt measured optically, ϴopt (■), with the molecular tilt calculated from the layer spacing measurements, ϴXRD (○), for OX10/6 material.
Figure 9. (Colour online) Schematic bar diagram showing the phase sequence for OXm/n in comparison with the analogous ZLm/n compounds. Phases are distinguished by different colours and/or a pattern.
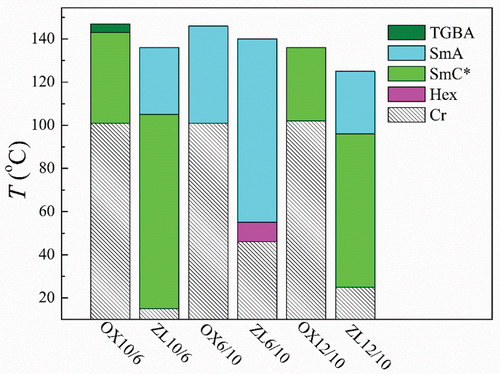
Figure 10. (Colour online) Conformations of (a) OX1/2 and (b) ZL1/2 calculated as the global minimum of the potential energy obtained at B3LYP6-311Gdp level of theory.