Figures & data
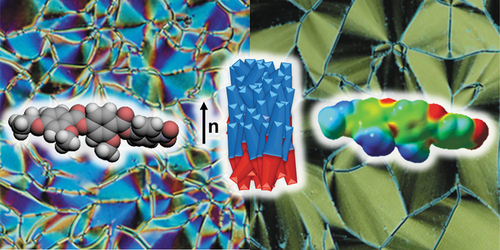
Figure 1. (Colour online) Schematic representations of the conventional nematic, N, phase (left) and the polar ferroelectric nematic, NF, phase (right).
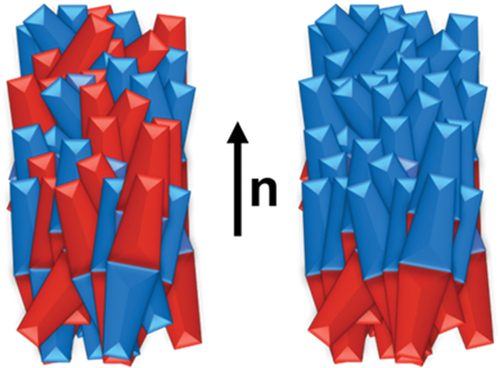
Figure 2. Molecular structures of the 7-m-n and 8-m-n series; m is the number of carbons in the lateral alkoxy chain and n is the number of carbons in the terminal alkoxy chain. For m = 0 the lateral group is a H atom.
Figure 3. Molecular structures of the 11-m-n and 12-m-n series; m is the number of carbons in the lateral alkoxy chain and n is the number of carbons in the terminal alkoxy chain. For m = 0 the lateral group is a H atom.
Figure 4. Molecular structures of 18-2-1 and 19-2-1.
Scheme 1. Synthetic route for the 7-m-n and 8-m-n series.
Scheme 2. Synthetic route for 11-0-1, 12-0-1 and 12-2-2.
Scheme 3. Synthetic route for 18-2-1 and 19-2-1.
Figure 5. (Colour online) Polarised optical microscope textures observed for the 7-m-n series: (a) coalescence of droplets at the NF-I phase transition for 7-1-1 in untreated glass slides (T = 104°C), (b) banded texture of the NF phase in 7-2-1 in untreated glass slides (T = 80°C), (c) banded texture of the NF phase in 7-2-2 in a cell treated for planar alignment (T = 70°C).
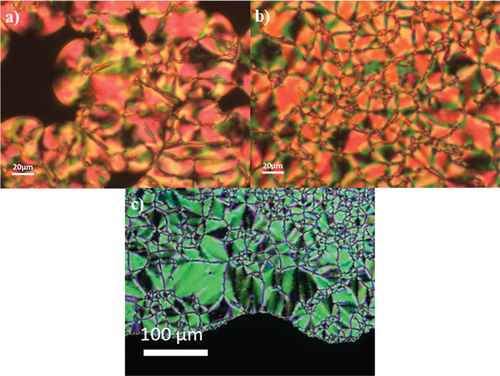
Table 1. Transition temperatures and associated entropy changes for the 7-m-n series. The calculated dipole moments, µ, are also listed. The data for 7-0-1 have been extracted from Tufaha et al. [Citation36].
Figure 6. (Colour online) Polarised optical microscope textures observed for the 8-m-n series: (a) banded texture of the NF phase in 8-2-1 in a planar aligned cell (T = 80°C), (b) banded texture of the NF phase in 8-1-2 in a cell treated for planar alignment (T = 80°C), (c) uncharacteristic texture of the NF phase in 8-2-2 in a cell treated for planar alignment (T = 75°C).
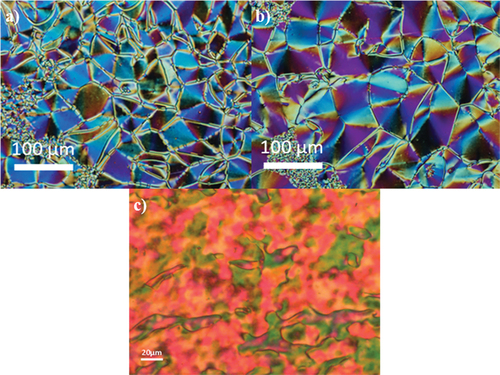
Figure 7. (Colour online) (a) The switching current (blue line) associated with polarisation reversal under an applied triangular wave voltage (black line) for 8-2-2 at 65°C. Measurements were performed in a 5-μm-thick cell with ITO electrodes and no alignment layer. (b) Real (left) and imaginary (right) parts of the complex dielectric permittivity measured vs temperature and frequency for 8-2-2, in a 5-µm-thick cell with ITO electrodes and no alignment layer.
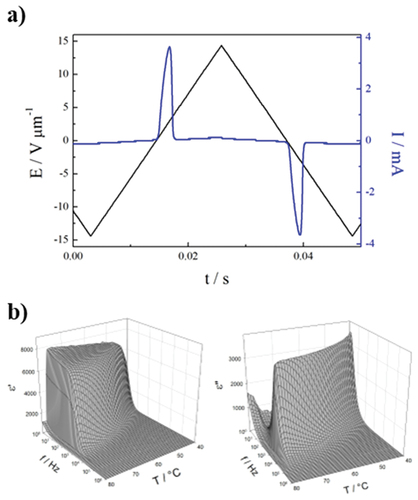
Table 2. Transition temperatures and associated entropy changes for the 8-m-n series. The calculated dipole moments, µ, are also listed. The data for 8-0-1 have been extracted from Tufaha et al. [Citation36].
Figure 8. (Colour online) Polarised optical microscope texture observed for 19-2-1 in a cell treated for homeotropic alignment showing the banded texture of the NF phase (T = 74°C).
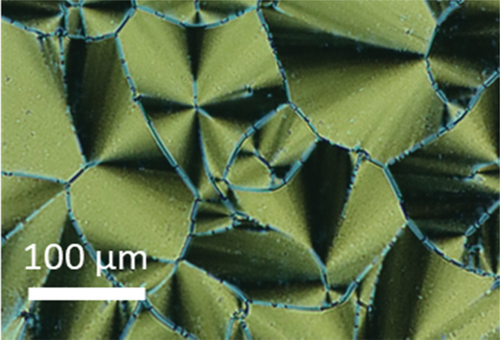
Table 3. Transition temperatures and associated entropy changes for 18-2-1 and 19-2-1. The calculated dipole moments, µ, are also listed.
Figure 9. (Colour online) Polarised optical microscope textures observed for 12-2-2: (a) schlieren texture of the N phase in untreated glass slides (T = 108°C) and (b) banded texture of the NF phase in a cell treated for planar alignment (T = 102°C).
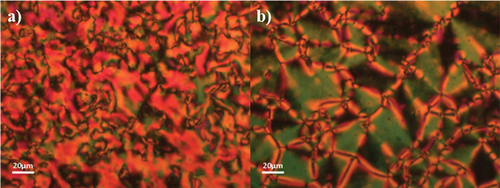
Table 4. Transition temperatures and associated entropy changes for the 11-m-n and 12-m-n series. The calculated dipole moments, µ, are also listed.
Figure 10. (Colour online) The space-filling models (top), electrostatic potential surfaces (middle) and ball-and-stick models of (a) 11-0-1, (b) 11-1-1 (RM734), (c) 7-0-1 and (d) 7-1-1, calculated at the B3LYP/6-31(d) level of theory. The arrow indicates the direction of the calculated dipole moment, with the head representing positive charge moving to the base which is negative.
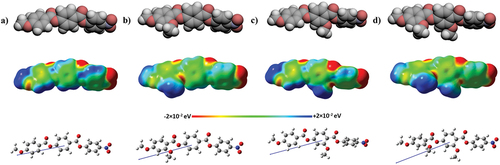
Figure 11. (Colour online) Comparison of the transition temperatures of the materials with a single alkoxy group (left bar) with the corresponding materials with two alkoxy groups (right bar). The top of the open bar shows the N-I transition and of the filled bar the NF-N/I transition. Compounds with X = H (top) and with X = F (bottom). The shaded areas mark the temperature range in which the samples had crystallised on cooling as measured by DSC. The transition temperatures reported for 12-2-2 and NT3F.2 were measured using polarised optical microscopy.
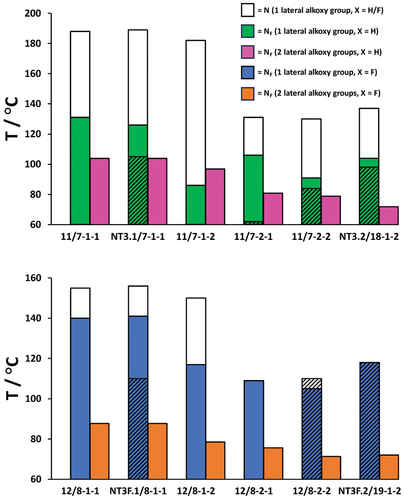
Figure 12. Comparison of the values of TNFI of the 7-m-n series (open bars) and 8-m-n series (filled bars), with the top of the bars showing the transition to the NF phase.
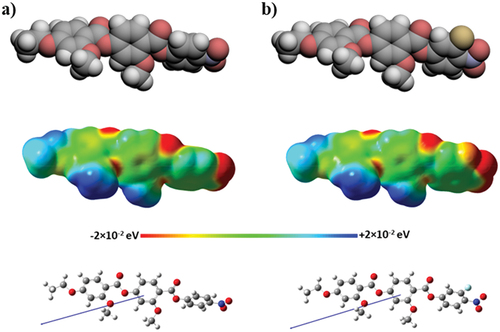
Figure 13. (Colour online) The space-filling models (top), electrostatic potential surfaces (middle) and ball-and-stick models of (a) 7-1-2, and (b) 8-1-2, calculated at the B3LYP/6-31(d) level of theory. The arrow indicates the direction of the calculated dipole moment, with the head representing positive charge moving to the base which is negative.