Figures & data
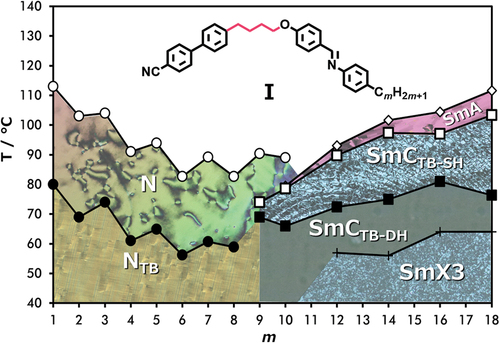
Figure 1. The molecular structure of the 1-(4-cyanobiphenyl-4′-yl)-ω-(4-alkylanilinebenzylidene-4′-oxy)alkanes (CBnO.m).
Scheme 1. Synthetic route to the CBnO.m dimers.
Figure 2. The dependence of the transition temperatures on the length on the terminal chain, m, for the (a) CB4O.m and (b) CB8O.m series. Grey striped areas mark the range of monotropic LC phase behaviour.
Figure 3. (Colour online) POM textures obtained for CB4O.5 in (a) (c) nematic and (b) (d) twist-bend nematic phases in untreated slides (a,b) and cells with planar alignment (c,d).
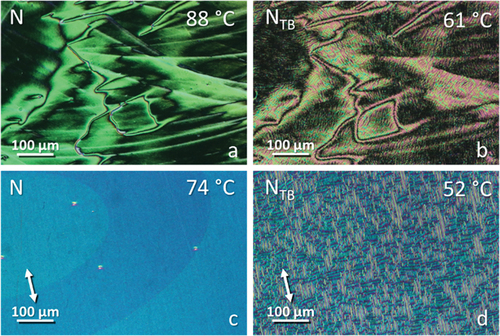
Table 1. Phase transition temperatures (°C) and associated entropy changes (in parenthesis, scaled by R) for the CB4O.m series.
Figure 4. (Colour online) POM textures obtained for CB4O.14 in (a) smectic A, (b) smectic CTB-SH, (c) smectic CTB-DH and (d) smectic X3 phases in untreated slides.
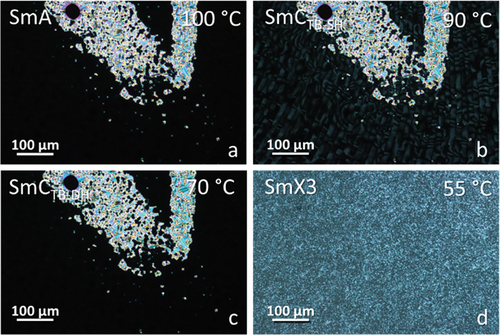
Figure 5. (Colour online) Optical birefringence as a function of temperature for CB4O.9 (black line) and CB4O.10 (red line).
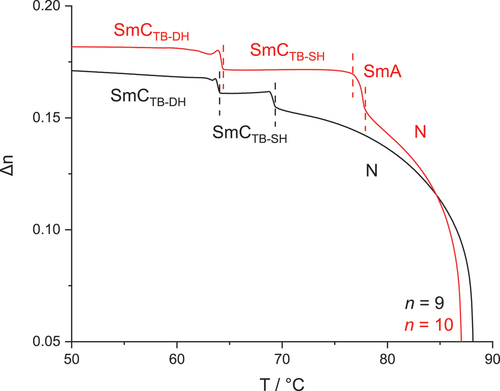
Figure 6. (Colour online) Periodicities corresponding to diffraction signals recorded under resonance condition for CB4O.12, the inset shows the temperature evolution of the RSoXS signals.
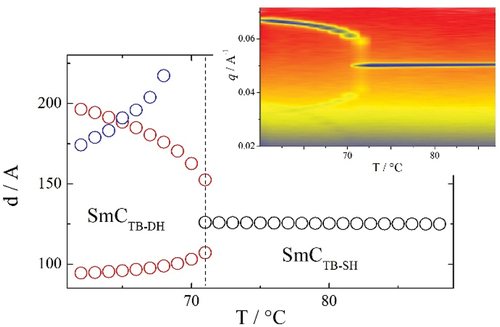
Table 2. Phase transition temperatures (°C) and associated entropy changes (in parenthesis, scaled by R) for the CB8O.m series.
Figure 7. (Colour online) POM textures obtained for CB8O.4 in (a) nematic, (b) twist-bend nematic, (c) (d) smectic CA before and after mechanical shear, respectively, (e) SmX1 and (f) SmX2 phases.
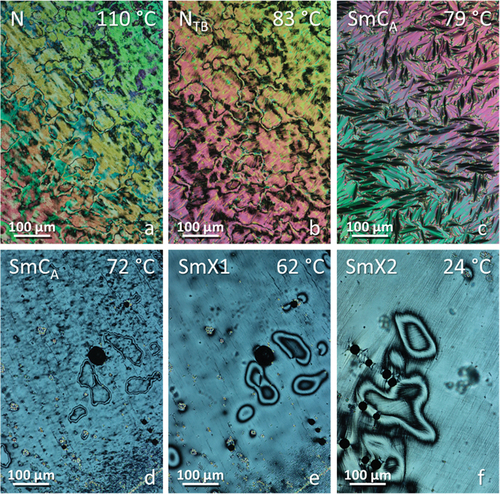
Figure 8. (Colour online) X-ray diffraction patterns for CB8O.3 and CB8O.18.
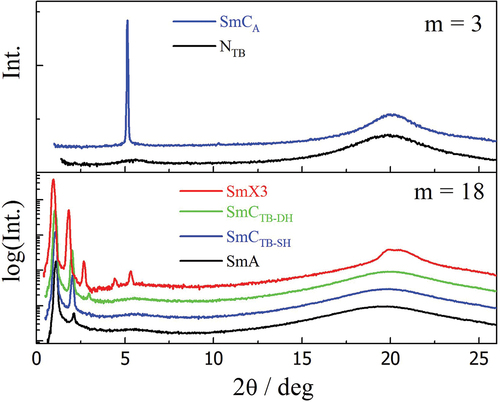
Figure 9. The dependence of the transition temperatures on the length on the terminal chain, m, for the (a) CB6O.m and (b) CB10O.m series. Grey striped area marks the monotropic range of the mesophases.
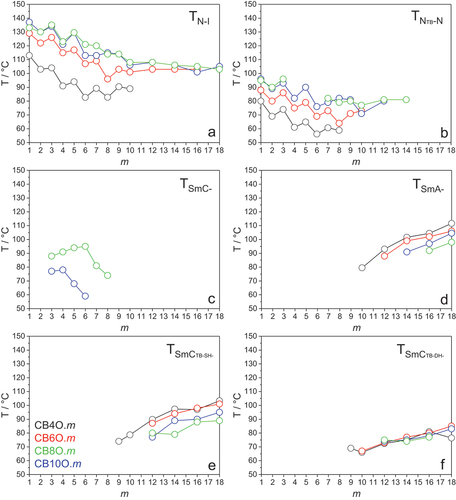
Figure 10. (Colour online) A comparison of the phase transition temperatures for CBnO.m series, where n = 4, 6, 8, 10 and m = 1–10, 12, 14, 16, 18.