Figures & data
Figure 1. Graphical representation of the control-process model of coping with boredom.
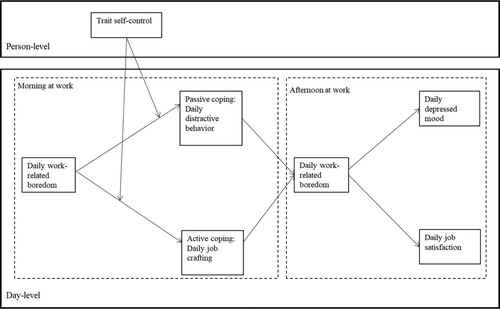
Table 1. Means, standard deviations, percentage within person variance, and correlations between study variables.
Figure 2. Results of multilevel path analysis (SE’s of estimates between parentheses; * p < .05, **p < .01).
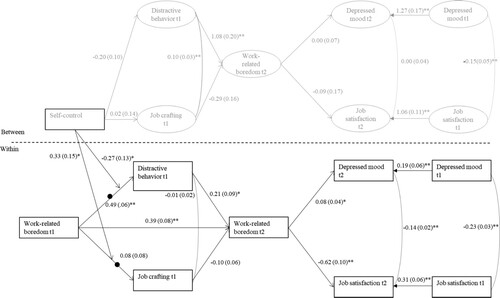
Figure 3. Association between work-related boredom t1 and distractive behaviour t1 for high (M + 1 SD) and low (M − 1 SD) levels of trait self-control.
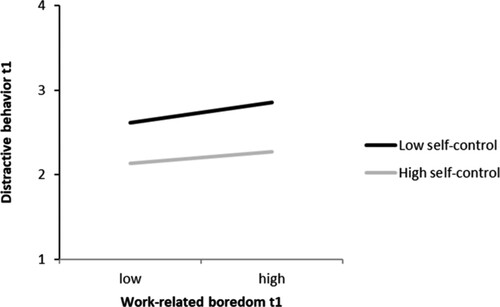
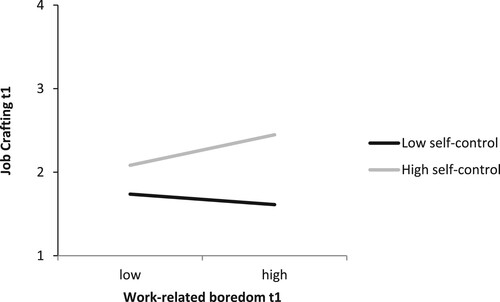
Figure 4. Association between work-related boredom t1 and job crafting t1 for high (M + 1 SD) and low (M − 1 SD) levels of trait self-control.