Figures & data
Figure 1. Reflective diary template – students were provided with a template to support them in structuring their observations and reflections. The template was duplicated and filled-in once per week.
Figure 2. SharePoint homepage – students were allocated three separate topics related to climate change. Shown are examples of three homepages relating to (a) crop yield, (b) drinking water salinity and (c) fungal growth. This illustrates that there were design similarities between the modern pages including the use of images, videos and quizzes, despite the different topics.
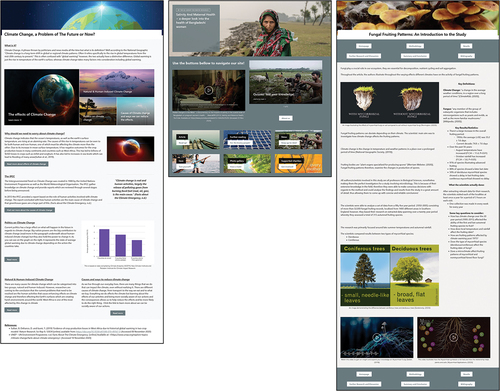
Table 1. Grade classification – shows the number of groups that achieved each grade classification for each of the assigned papers.
Figure 3. Common skills – a word cloud displaying the most mentioned skills in student reflective commentaries.
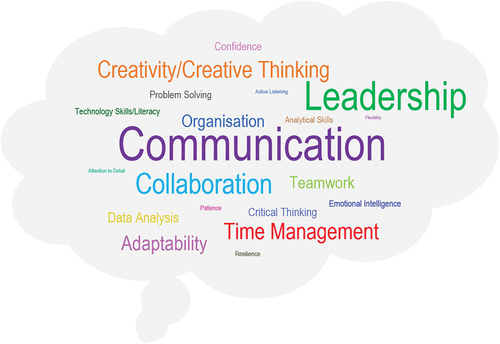
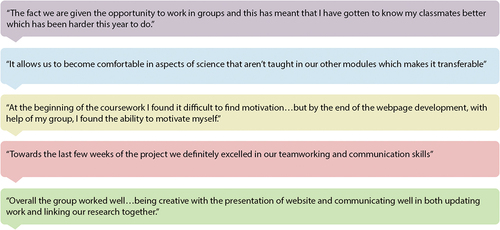
Figure 4. Student feedback – a selection of feedback that students provided about their experiences of the assessment as part of their reflective commentary.