
Figures & data
Figure 1. Directing and representing intermediaries.
Note: In both figures, B is the intermediary actor. A is the macro-level actor and C are the micro-level actors.
Figure 2. Blank network showing actor groups by level and sector.
Notes: Figure shows the actors and potential relations in the network to clarify actors groups’ level and sector. The three vertical levels show the macro level (federal government), intermediary level (regional governments and employers’ associations), and micro level (schools and firms). Horizontally, the left-side actor groups belong to the public sector (federal and regional governments, schools) and the right-side actor groups belong to the private sector (employers’ associations and firms). Dotted lines show where we expect to find relations in the network, including within-group relations shown as outlines around each actor group.
Table 1. Respondents by actor group.
Table 2. Data and method for each research question and hypothesis.
Table 3. Adjacency matrix showing the percent of adjacency among pairs.
Figure 3. Actor-level network with relation strength and satisfaction.
Notes: Line thickness represents relation load, and color is satisfaction according to the scale shown in the top-right corner. Relations flow in the direction that arrows indicate. Within-group relations are shown as outlines around each actor group. On the vertical axis, we show actor levels, with the federal government at the macro level, our intermediaries at the middle level, and schools and firms occupying the micro level. The horizontal axis differentiates the public (left) and private (right) sectors.
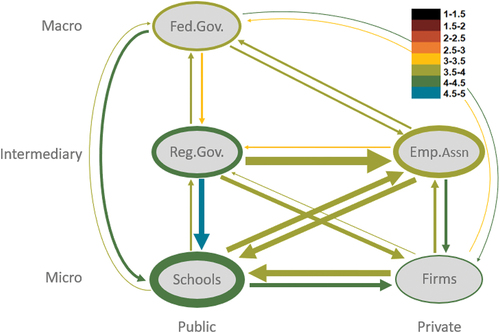
Table 4. Blocked matrix of satisfaction and relation load by sector.
Table 5. Table of actors’ eigenvalues, investment in the network, and residuals.
Figure 4. Hypothesized (above) vs. observed (below) intermediary behavior.
Notes: Figure shows hypothesized intermediary roles in the upper half and observed roles in the lower half. A is the macro-level actor, B is the intermediary, and C are micro-level actors.
Table A1. Network summary.