
Figures & data
Figure 1. Conceptualisation of research question. Notes: The arrows indicate expected causality. Source: Own illustration.
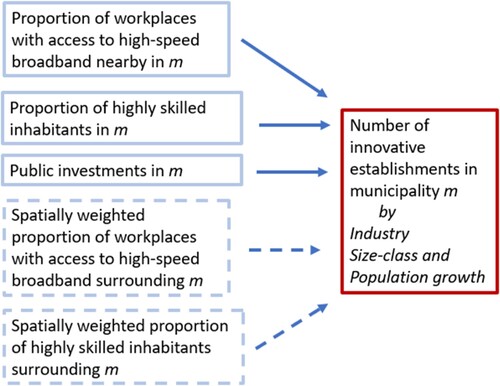
Figure 2. Declining municipalities in Sweden. Notes: There are 290 municipalities in Sweden. Approximately one out of five experience a decline in population during the years 2010–2021 (darker shade). Source: Statistics Sweden.
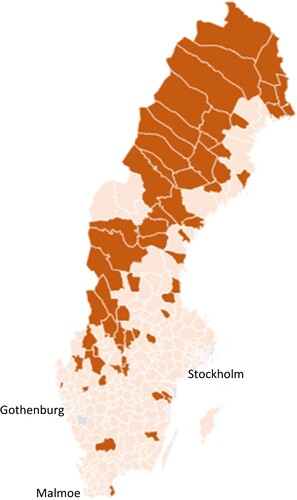
Table 1. Development of number of innovative establishments.
Figure 3. Proportion of establishments with high-speed broadband access nearby (per cent). Notes: The evolution is measured as unweighted means across municipalities. Source: Swedish Post and Telecommunication Agency.
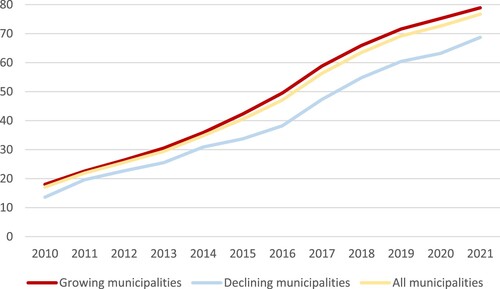
Table 2. Development of independent variables across municipalities, unweighted averages.
Table 3. Summary statistics estimation dataset.
Table 4. Importance of high-speed broadband access for innovative establishments across municipalities, Fixed Effects Poisson regressions.
Table 5. Importance of high-speed broadband access for innovative establishments in declining municipalities, Fixed Effects-Poisson regressions.
Table 6. Importance of high-speed broadband access for innovative establishments including spatial dependencies across municipalities, Spatial Fixed Effects-Poisson regressions.
Figure 4. Estimates of quadratic form of high-speed broadband access on ICT establishments. Notes: Calculated using the delta method based on specification in upper panel (Specifications i and ii) and augmented by a quadratic term for broadband access. Source: Kommuninvest, Statistics Sweden, Swedish Agency for Economic and Regional Growth, Swedish Post and Telecommunication Agency and own calculations.
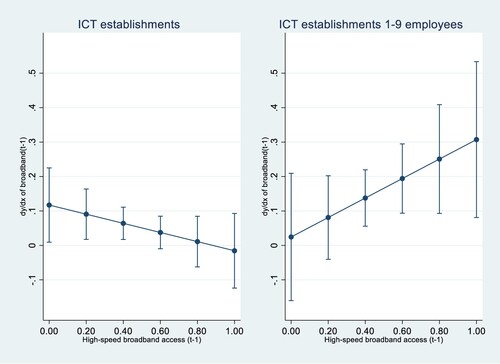
Table 7. Importance of high-speed broadband access for the number of ICT establishments across municipalities, controlling for endogeneity.
Data availability statement:
Data on the number of establishments is confidential and cannot be shared.