2,380
Views
38
CrossRef citations to date
0
Altmetric
Original Articles

Using TMS to study the role of the articulatory motor system in speech perception

&
Pages 1103-1118 | Published online: 09 Nov 2011

Figures & data

Figure 1. MEP sizes elicited in the contralateral orbicularis oris muscle by single-pulse TMS over the lip representation of left M1. Bars show the mean (+ standard error; SEM) change in MEP size (mV.ms) from a baseline condition (in which participants viewed visual noise and listened to white noise) while participants (n = 13) were listening to speech (Speech, mean = 167.65, SEM = 70.62) or environmental sounds (Nonspeech, mean = 67.10, SEM = 43.86), or viewing speech-related lip movements (Lips, mean = 114.33, SEM = 57.82) or eye and brow movements (Eyes, mean = –28.14, SEM = 41.86). MEP sizes (area under the curve of the rectified electromyographic recording) were adjusted for background contraction of the lip muscle using analysis of covariance (for details see Watkins et al., Citation2003). A paired t-test was used to compare MEP areas in each of these conditions with those in the baseline. The MEPs for the Speech and Lips conditions were significantly increased relative to the baseline condition (*p < .05).
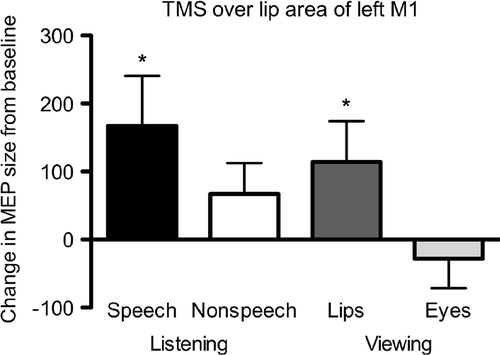
Figure 1. MEP sizes elicited in the contralateral orbicularis oris muscle by single-pulse TMS over the lip representation of left M1. Bars show the mean (+ standard error; SEM) change in MEP size (mV.ms) from a baseline condition (in which participants viewed visual noise and listened to white noise) while participants (n = 13) were listening to speech (Speech, mean = 167.65, SEM = 70.62) or environmental sounds (Nonspeech, mean = 67.10, SEM = 43.86), or viewing speech-related lip movements (Lips, mean = 114.33, SEM = 57.82) or eye and brow movements (Eyes, mean = –28.14, SEM = 41.86). MEP sizes (area under the curve of the rectified electromyographic recording) were adjusted for background contraction of the lip muscle using analysis of covariance (for details see Watkins et al., Citation2003). A paired t-test was used to compare MEP areas in each of these conditions with those in the baseline. The MEPs for the Speech and Lips conditions were significantly increased relative to the baseline condition (*p < .05).

Figure 2. The effect of TMS-induced disruption in the motor lip representation on discrimination of speech sounds. Participants were presented with synthetic speech sounds from eight-step acoustic continua between two speech sounds. The pairs of sounds were categorised as “across-category” and “within-category” pairs based on the place of category boundaries that were determined for each participant individually. In the discrimination task participants were presented with pairs of synthetic speech sounds and asked to indicate whether the sounds are “same” or “different”. Proportions of “different” responses are plotted. Participants gave more “different” responses when discriminating across-category pairs than within-category pairs, indicating categorical perception of speech sounds. Each participant performed the discrimination tasks before a low-frequency TMS train was applied over the lip representation in the left M1 cortex (pre-TMS) and after it (post-TMS). After TMS, participants were poorer in discriminating across-category pairs that included lip-articulated speech sounds (“ba” vs “da” and “pa” vs “ta”) than before TMS. Discriminability of other pairs stayed stable. Data are from Möttönen and Watkins (Citation2009). *p < .01, **p < .001.
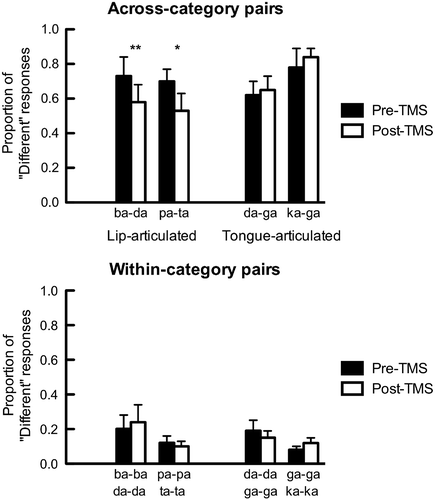
Figure 2. The effect of TMS-induced disruption in the motor lip representation on discrimination of speech sounds. Participants were presented with synthetic speech sounds from eight-step acoustic continua between two speech sounds. The pairs of sounds were categorised as “across-category” and “within-category” pairs based on the place of category boundaries that were determined for each participant individually. In the discrimination task participants were presented with pairs of synthetic speech sounds and asked to indicate whether the sounds are “same” or “different”. Proportions of “different” responses are plotted. Participants gave more “different” responses when discriminating across-category pairs than within-category pairs, indicating categorical perception of speech sounds. Each participant performed the discrimination tasks before a low-frequency TMS train was applied over the lip representation in the left M1 cortex (pre-TMS) and after it (post-TMS). After TMS, participants were poorer in discriminating across-category pairs that included lip-articulated speech sounds (“ba” vs “da” and “pa” vs “ta”) than before TMS. Discriminability of other pairs stayed stable. Data are from Möttönen and Watkins (Citation2009). *p < .01, **p < .001.