Figures & data
Table 1. Demographic and clinical information about study participants.
Table 2. Schedule of study.
Figure 1. Percent correct of target words by time in therapy protocol and word set.
Figure 2. Percent correct of target words by therapy phase and word set.
Figure 3. Percent correct for nouns and verbs by therapy phase.
Figure 4. Outcome of game therapy for individual participants in picture naming and scene description for trained words. Panel A: immediately after game therapy; Panel B: 2–3 weeks afterward therapy; Panel C: 5–6 months after therapy for Cohort 1. Performance in % correct for all three word sets (A, B, and C) collapsed (N = 180). Asterisks mark significant differences evaluated with chi-square for individual participants and with t-tests for the group (MEAN).
Figure 5. Outcome of game therapy for individual participants in measures not targeting trained words. Outcomes compare performance before any game therapy (T2) with performance at the end of all game therapy (T5). Asterisks mark significant differences evaluated with chi-square for individual participants and with paired, one-tailed t-tests for the group (MEAN). As there is no set total for the CAT or word count in narrative production, individual chi-squares could not be performed for these measures.
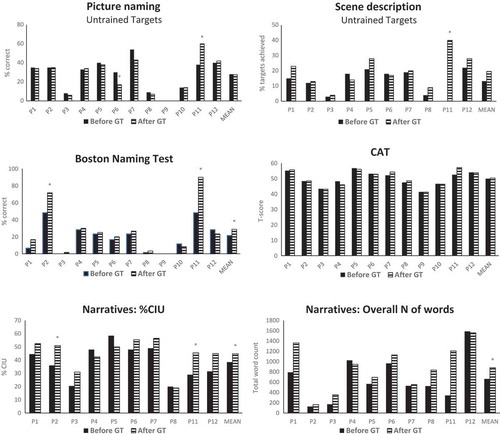
Figure 6. Individual outcomes after standard therapy (ST). Asterisks mark significant differences evaluated with chi-square for individual participants and with paired, one-tailed t-tests for the group (MEAN). As there is no set total for the CAT or word count in narrative production, individual chi-squares could not be performed for these measures.