
Figures & data
Figure 1. Example of the Akan TART-comprehension, with the target sentence “the man ate the orange”, as in (3)
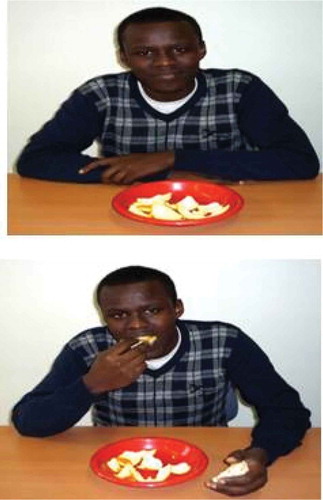
Figure 2. Example of the Akan TART-production pictures depicting present habitual aspect in Akan. The Akan verbs twerɛ: to write and kan: to read, as in (4) are written above the respective pictures
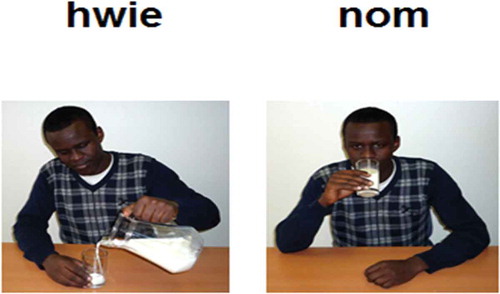
Figure 3. Percent mean accuracy scores per condition per group of participants in comprehension-TART, including error bars
Figure 4. Percent mean accuracy scores per condition per group of participants in comprehension-TART, including error bars
Table 1. Percentage of accuracy scores on non-/linguistic tone discrimination task
Table 2. Generalized linear mixed model output on the Akan agrammatic speakers’ accuracy
Table 3. Distribution of error types
Appendix A1. Demographic data of the agrammatic speakers and the none-brain-damaged speakers