Figures & data
Figure 1. Flow-chart of patients included in the study
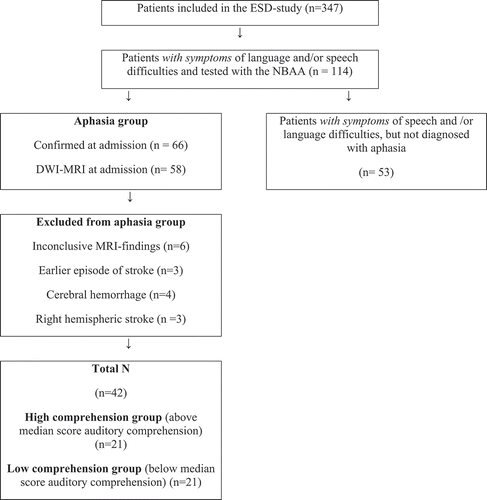
Table 1. Descriptive statistics of the patients scores on the Norwegian Basic Aphasia Assessment (n = 42)
Table 2. VLSM-analysis of lesions associated with patients scores on the subtests repetition and naming, MNI-coordinates in parenthesis (n = 42)
Table 3. Independent samples t-test of all subtests from the NBAA between the patients who scored above the median and the group who scored below the median (55.5) on the auditory comprehension subtest from the NBAA
Figure 2. Colorized maps depicting lesion overlaps in the left hemisphere in the high comprehension group (left, group 1) and the low comprehension group (right, group 2) (n = 21 each group). Warmer areas (red) illustrate a greater lesion overlap than colder areas (purple/blue). Maximum overlap in individual voxels in the high comprehension group was 6, and 11 in the low comprehension group. Mean lesion was 19,019.43mm3 in the high comprehension group, and 43,443.81mm3 in the low comprehension group
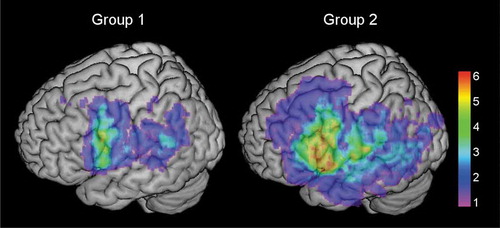
Table 4. VLSM-analysis of lesions associated with overall aphasia severity, repetition, naming and reading out loud in the high comprehension group, MNI-coordinates in parenthesis (n = 21)
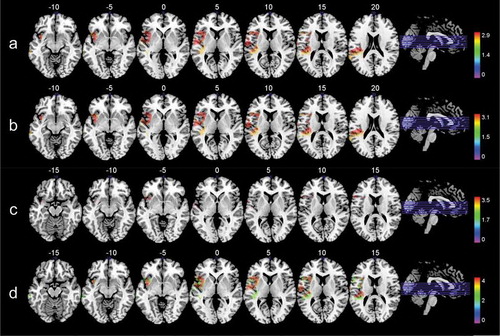
Figure 3. Colorized multislice maps of lesions associated with A: aphasia severity, B: repetition, C: naming, D: reading out loud in the high comprehension group (n = 21). All maps include FDR-corrections with permutations, p < .05. Warmer areas (red) indicate a greater lesion overlap than colder areas (purple/blue). Color bars indicate Z scores