
Figures & data
Table 1. Participant demographic and stroke characteristics
Table 2. TIDieR checklist as applied in this study (Hoffmann et al., Citation2014)
Table 3. Measures of therapeutic inputs calculated by SALT software – TIDieR Item 8
Table 4. Measures of therapeutic inputs – TIDieR Item 9
Table 5. Summary of the number of tasks completed across the therapy sessions
Table 6. Tasks completed in treatment sessions
Table 7. Summary of verbal output from therapists per session
Figure 1. Average number of cues used by cue category per session
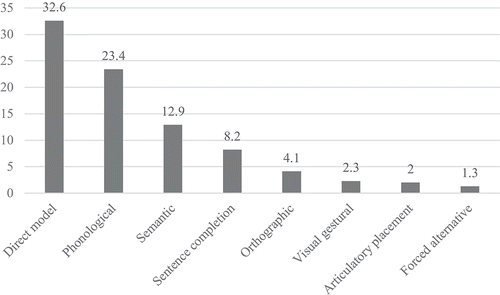
Figure 2. Average number of times a cue was used with success in a session by cue category
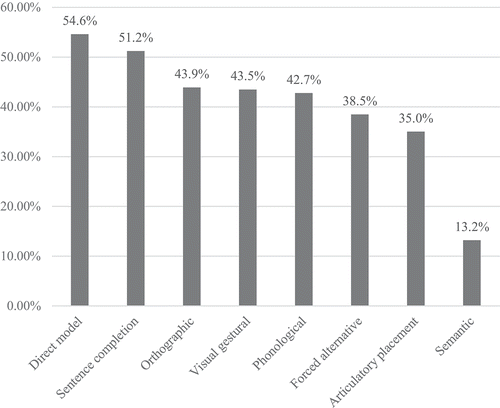
Table 8. Summary of types of feedback used by therapists per session