
Figures & data
Figure 1. A schematic model of word production
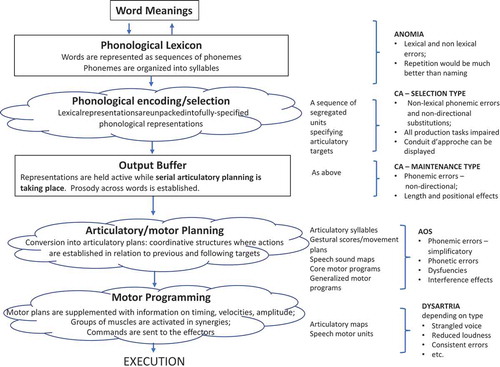
Figure 2. CS’s CT scan
Table 1. CS’s performance in semantic tasks, input tasks, and STM. All tasks, except for the probe task, are from PALPA
Table 2. CS’s errors in repetition, reading and naming. For naming only initial full responses were scored. Percentages are based on the number of word stimuli
Table 3. Proportion of different kinds of phoneme errors across tasks. Note that the number of non-lexical errors is higher in this analysis because a non-lexical error may contain more than one phonemic error (e.g., two different phoneme substitutions or a substitution plus a deletion). Percentages are based on the total number of individual phoneme errors
Table 4. Number of repeated attempts according to type of initial response and outcome (word repetition and reading collapsed). Incomplete responses can either start correct and build up the target from smaller units or start incorrect. Percentages are based, initially, on the total number of word stimuli (column 3) and then on the number of responses of each type (columns 5 and 7)
Table 5. Errors by word length in number of phonemes: a) % errors over number of target words: b) % of repeated attempts (RAs) over number of target words; c) percentage of individual phoneme errors over number of target phonemes. Indiv Err = Individual phonological errors. Percentages are based on the total number of word stimuli in each length category and then on the total number of individual phonemes in the stimuli
Table 6. Number of errors in different frequency categories. Percentages are based on the number of stimulus words in each category. RA=repeatedattempts
Figure 3. Percentage of phonemes produced correctly as a function of serial position in the target and target length
Table 7. Deletion and insertion errors which simplify or complicate syllable structure. N err = Number of errors
Table 8. Number and percentages of errors on different phonemes across production tasks (word repetition, word reading, and picture naming). stim = stimuli; sub = substitution errors; Most common = most common substitution error for a given phoneme. Percentages are based on the total number of individual phonemes in the stimuli
Table 9. Number of errors which change phonological features. Percentages are based on the number of phonemes from target stimuli. Fric = Fricative; Alv. = Alveolar; Pal = Palatalized