Figures & data
Figure 1. Overview of the study procedure.
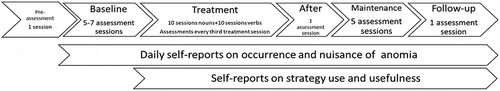
Table 1. Participants
Figure 2. Accuracy and speed in repeatedly measured confrontation naming of treated and untreated items.
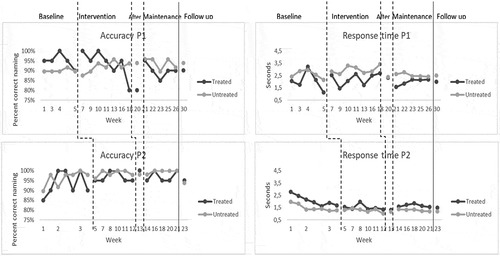
Table 2. Accuracy and speed in the confrontation-naming tasks
Figure 3. On the left: number of words per minute and number of correct information units (CIUs) per minute in the re-telling task. On the right: percentage of CIUs (%CIU) in the re-telling task.
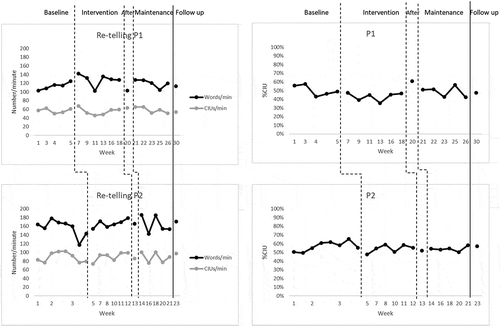
Figure 4. Self-reports. On top: means and range values per week of the daily ratings of occurrence of anomia and related nuisance (scale: 0 “Not at all” to 4 “On numerous occasions”/“Significantly”). At bottom: weekly self-reported use and usefulness of the SFA strategy (scale: 0 “Not at all” to 4 “On numerous occasions”/“Fairly consistently”), collected in assessment sessions after the baseline (B), i.e., in the intervention phase (I), directly after the intervention (After), in the maintenance phase (M) and at the follow-up session.
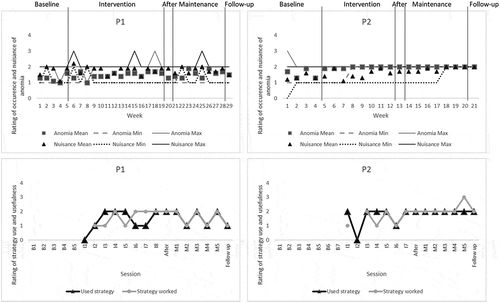
Table 3. Self-reported communicative participation
Figure 5. Scores on the number-repetition control task.
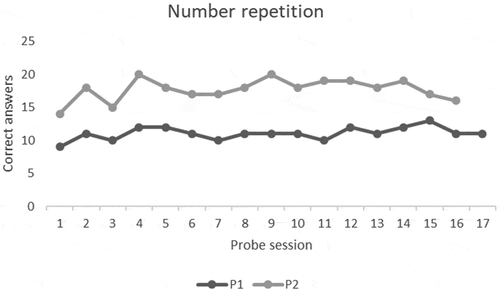
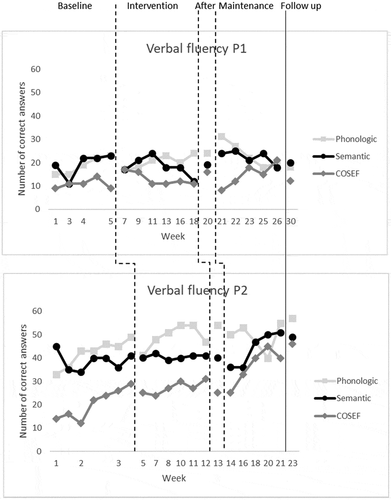
Figure 6. Number of correct answers in the verbal-fluency control tasks.