
Figures & data
Figure 1. Bar graphs showing the pre (darker bars) and post (lighter bars) means GAS scores for short, medium, long term (blue) and economic goals (brown), with upper 95% confidence intervals. A change score of 10 points, considered to be clinically meaningful, is shown with broken red arrows.
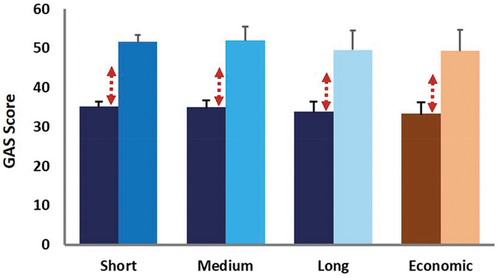
Figure 2. Scatterplots showing the relationship between change score (Δ) and months post stroke (x-axis) for short-term goals (STG) and economic goals (EG). r2 are 0.13 and 0.31 respectively.
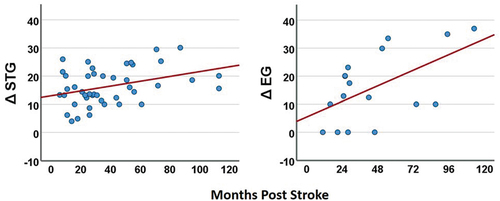
Table 1 The themes and sub-themes developed from patients’ goals.