Figures & data
Table 1. Demographic and testing information for all participants
Table 2. Full list of stimulus words used in the experiment
Figure 1. Graphical user interfaces used in the experiment.
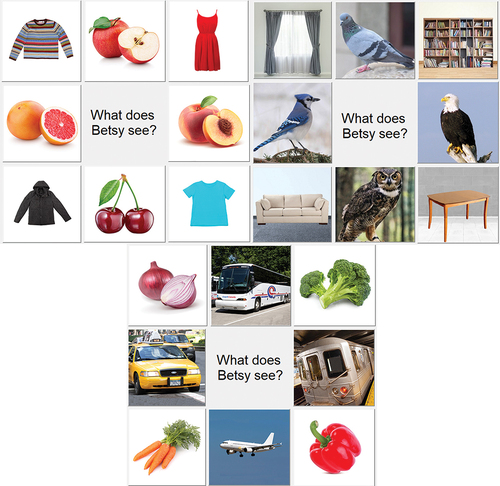
Figure 2. Interactive calibration screen used during the remote experiment. “999” represents the subject ID number.
Figure 3. Accuracy for remote testing. Error bars indicate standard deviation. Red horizontal line indicates chance performance (12.5%).
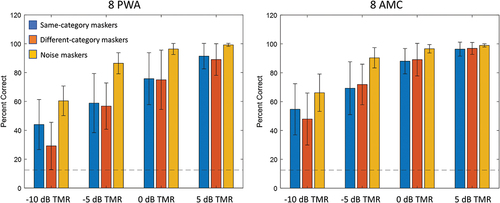
Figure 4. Accuracy for in-lab testing. Error bars indicate standard deviation; Red horizontal line indicates chance performance (12.5%).
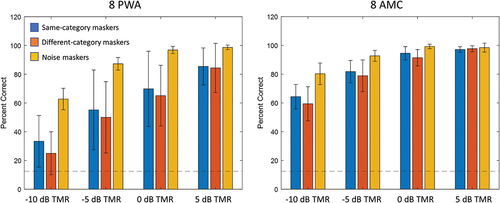
Figure 5. Psychometric functions for remote testing for each group in each condition. Horizontal dotted line indicates chance performance (12.5%); curved dotted lines indicate individual subject functions; solid lines indicate overall function produced by averaging fit parameters of individual subject functions; asterisk indicates 50% correct point on averaged function.
Figure 6. Psychometric functions for in-lab testing for each group in each condition. Horizontal dotted line indicates chance performance (12.5%); curved dotted lines indicate individual subject functions; solid lines indicate overall function produced by averaging fit parameters of individual subject functions; asterisk indicates 50% correct point on averaged function.
Table 3: Speech reception thresholds for each participant, in dB TMR.
Figure 7. Remote vs. in-lab performance for AMC and PWA. Error bars indicate standard deviation.
Figure 8. Correlations between remote and in-lab 50% correct points (pooled across groups, for all participants who completed both versions of the experiment).
Figure 9. Remote and in-lab performance for AMC and PWA in each condition. Error bars indicate standard deviation.
Figure 10. Error types (masker vs. random) in each group, in each testing location. Error bars indicate standard deviations.