
Figures & data
Figure 1. Project timeline for the implementation of the Comprehensive, High-dose Aphasia Treatment
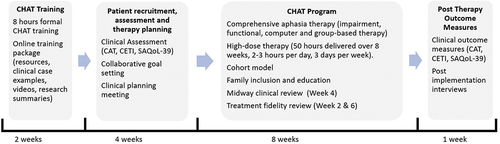
Table 1. Patient Demographic Information.
Table 2. Patients’ communication therapy goals and individualised therapy plan for CHAT.
Table 3. Outcome measures to evaluate the feasibility, acceptability and potential effectiveness of the implementation intervention and the CHAT program.
Figure 2. Logic model depicting implementation intervention components, intervention functions and behavioural determinants (domains) and outcomes.
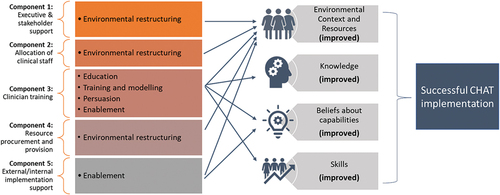
Table 4. CHAT speech pathologists’ behavioural determinants survey results (n = 2).
Table 5. Dose of comprehensive aphasia therapy received in therapy hours.
Table 6. Summary of main barriers and facilitators to delivering CHAT.
Table 7. Patient clinical assessment results.
Table A1. Potential effectiveness of implementation intervention components
Table B1.. Patient Satisfaction Survey