Figures & data
Table 1. Craniectomy details.
Table 2. Cranioplasty details.
Table 3. Morbidity and mortality.
Table 4. Morbidity stratified by cranioplasty material.
Figure 1. Classification of surgical morbidity. Frequency of patients with each Therapy-Disability-Neurology (TDN) grade, stratified by cranioplasty material which (A) occurred within 30 days and resolved, (B) occurred within 30 days and persisted, (C) occurred after 30 days and (D) for all patients both with and without surgical morbidity events, at any time. The surgical morbidity event that produced the highest grade was ultimately used for grading whee more than one event occurred in a particular patient. Grade 5 events (death) appear in Panel B as they are within 30 days and cannot resolve. The number at the top of each stacked bar states the total number of patients with a surgical morbidity event, within that timeframe. The number in association with each material on the x-axis states the frequency of insertion of that material in total.
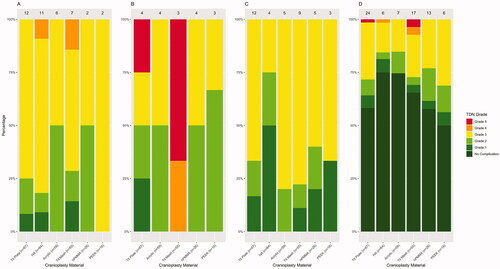
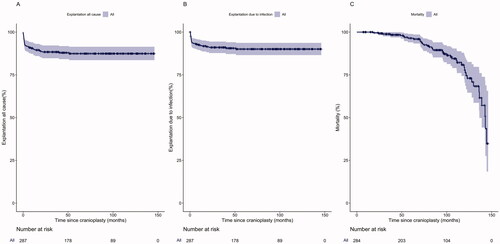
Figure 2. Explantation and mortality. Kaplan–Meier curves demonstrating (A) all-cause explantation free survival, (B) explantation due to infection free survival and (C) overall survival following cranioplasty. Shaded area indicates the 95% CI.