
Figures & data
Figure 1. PRISMA flow diagram for studies included and excluded.
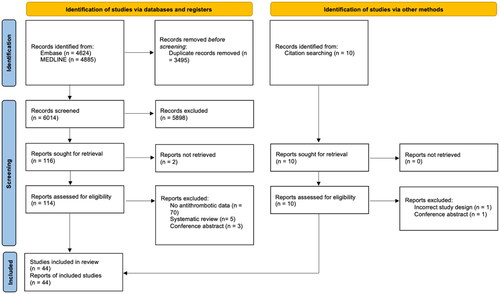
Figure 2. A. Odds ratio (OR) of recurrent CSDH after drainage in patients taking anticoagulant medication at diagnosis vs patients taking no antithrombotic drugs at CSDH diagnosis. B. Symmetrical funnel plot, demonstrating an absence of publication bias.
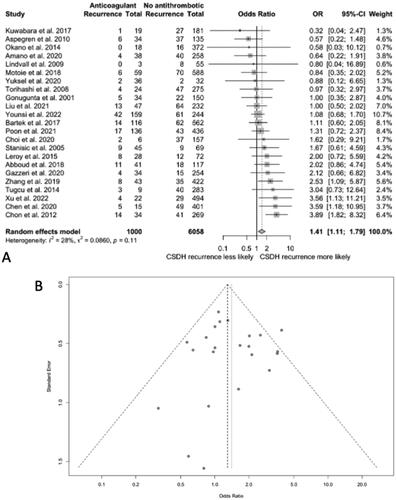
Figure 3. A. Odds ratio (OR) of recurrent CSDH after drainage in patients taking antiplatelet medication at diagnosis vs patients taking no antithrombotic drugs at CSDH diagnosis. B. A symmetrical funnel plot, demonstrating an absence of publication bias.
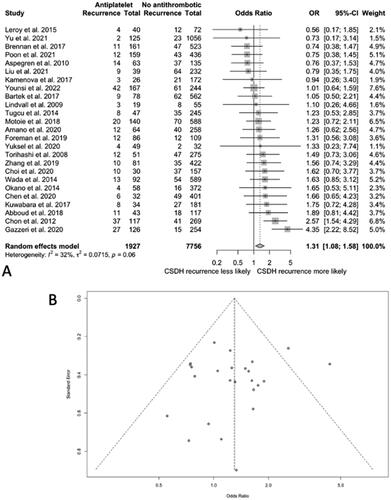
Figure 4. A. Odds ratio (OR) of vaso-occlusive events after drainage in patients taking antithrombotic medication at diagnosis vs patients taking no antithrombotic drugs at CSDH diagnosis. B. A funnel plot representing the reporting odds ratio values for vaso-occlusive event risk in patients taking antithrombotic risk at baseline.

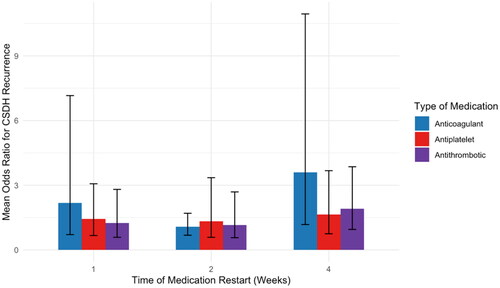
Figure 5. Mean odds ratio of CSDH recurrence by the time of medication restart. Error bars represent 95% confidence intervals.
Supplemental Material
Download Zip (242.8 KB)Data availability statement
Our full dataset can be found in the supplementary materials.