
Figures & data
Chart 1. Ownership index: banks, mutuals and NS&I.
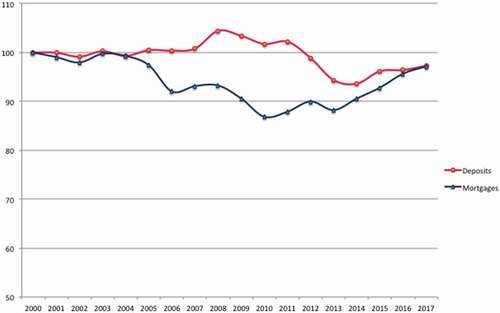
Chart 2. Competitiveness index: mortgage balances outstanding and UK deposits.
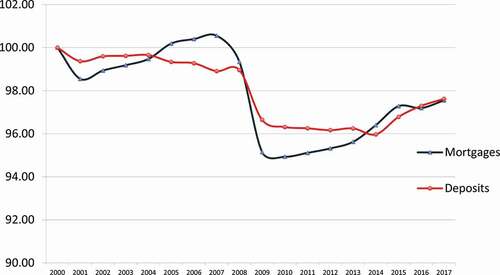
Chart 3. Major UK banks and mutuals customer funding gap as a proportion of customer loans and advances.
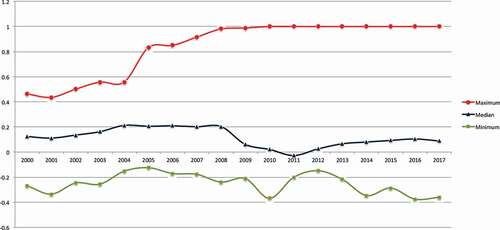
Chart 4. The Hirschmann-Herfindahl index of funding model concentration; market concentration of loan to deposit ratios.
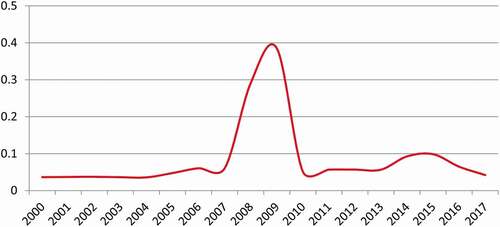
Chart 5. Resilience index.
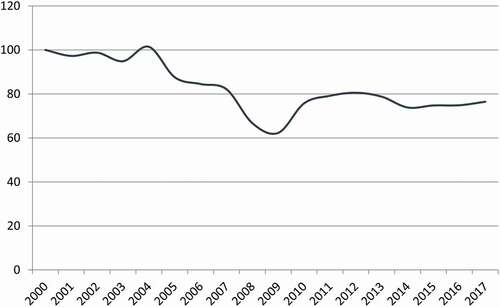
Chart 6. Geographic spread of head offices and strategic decision making.
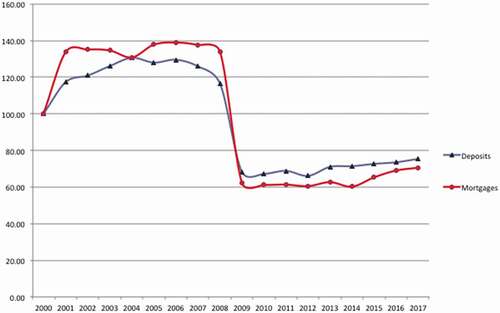
Figure 1. The D-index and its component sub-indexes.Footnote16
Chart 7. Diversity index for UK financial services (D-index): ownership, competitiveness, resilience & geographic spread.
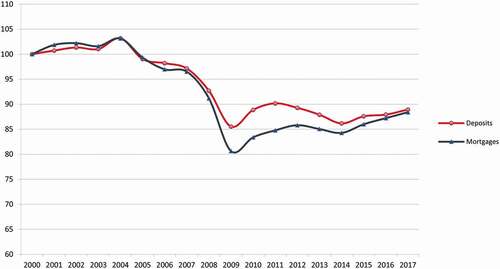
Chart 8. Mortgage-deposit rates spreads: banks and building societies.
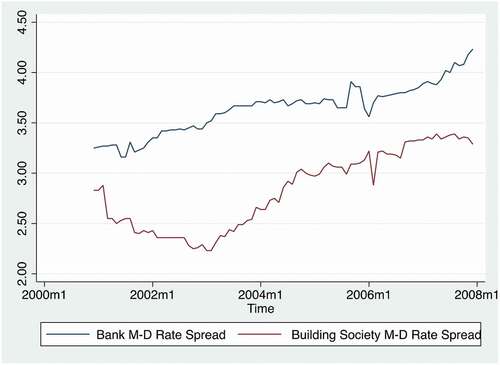
Chart 9. Bank and building society mortgage rates.
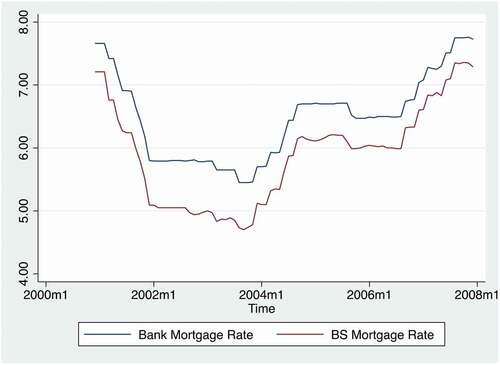
Chart 10. Bank and building society deposit rates.
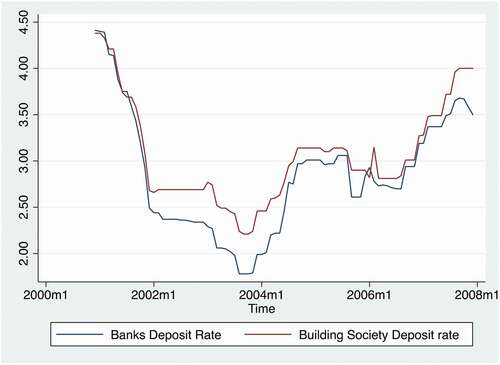
Table 1. Correlation matrix.
Table 2. Results from regressions of the bank mortgage-deposit rate spread (MDS) on the degree of competition (HH) and corporate ownership diversity (OD).