
Figures & data
Figure 1. Plots of the Gini index (left) and the top 10% income share (right), for the period 1980–2019.
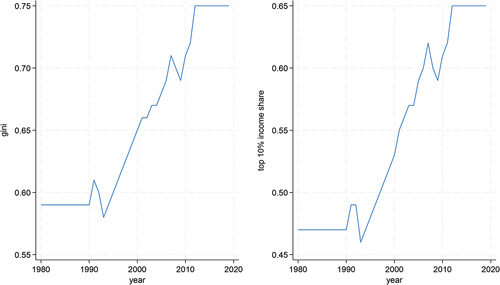
Table 1. Unit root test results.
Table 2. Bounds-test results.
Table 3. Critical values.
Table 4. Long-run investment results: LINV.
Table 5. Short-run investment results: ΔLINV.
Table 6. Long-run consumption results: CONS.
Table 7. Short-run consumption results: ΔCONS.
Figure 2. Plots of cumulative sums of recursive residuals and cumulative sums squares of recursive residuals: investment models.
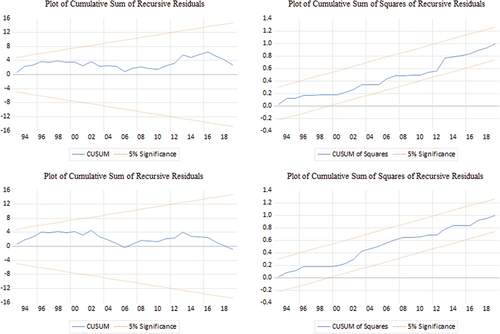
Figure 3. Plots of cumulative sums of recursive residuals and cumulative sums squares of recursive residuals: consumption model.
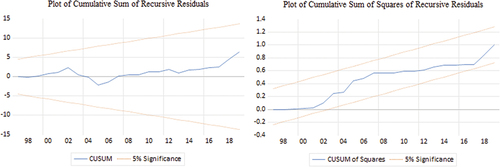
Table 8. Diagnostic tests.
Figure 4. Responses of investment (linv), consumption (lcons) and real GDP (lgdp) to unit shocks to credit growth (lcred), interest rates (lintr), house prices (lhpi), stock prices (lspi) and exchange rates (lexr).
Figure 5. Responses of investment (linv), consumption (lcons) and real GDP (lgdp) to unit shocks to the wage share (lws), profit share (lps) and income inequality (lincome10).
Figure 6. Responses of real GDP (lgdp) to consumption (lcons) and investment (linv), and responses of rate of profit (lrop) to consumption (lcons) and investment (linv).
Table A1. Data description and sources.
Table B1. Summary of descriptive statistics.
Data availability statement
The various data associated with this paper can be found in the South African central bank (SARB) website, the Organisation for Economic Cooperation and Development and the International Financial Statistics databases, the Word Inequality Database, and the World Profitability Dashboard.