2,551
Views
19
CrossRef citations to date
0
Altmetric
Articles

Current Constraints and Future Directions for Risk Adapted Land-Use Planning Practices in the High-Density Asian Setting of Ho Chi Minh City

Figures & data

Figure 1 The development of the built-up extent of HCMC for the period from 1989 to 2007. Source: Author's own.

Table 1 Estimated urban population as a percentage of total population (2010)
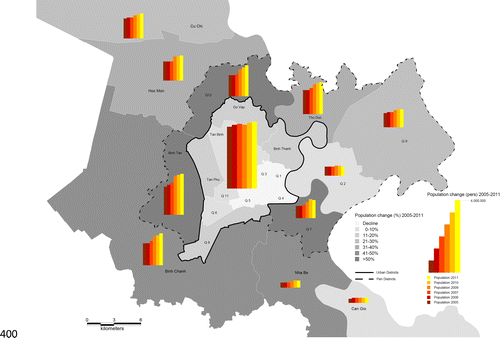
Figure 2 Spatial distribution of changes in population between 2000 and 2011 in HCMC. Source: Author's own.

Table 2 Urban structural changes in HCMC from 2005 to 2010—core indicators for changes in dominant building types
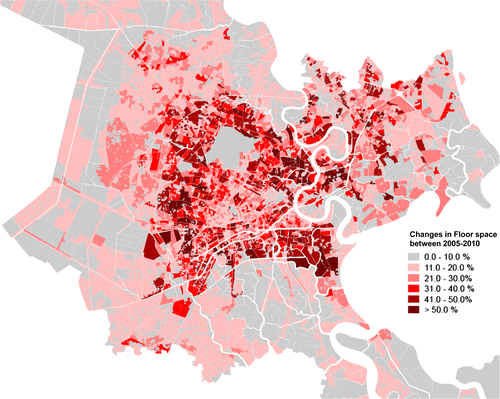
Figure 3 Changes in floor space between the years 2005 and 2010 mapped on land-use planning blocks. Source: Author's own.

Table 3 Structural and non-structural land-use planning options and measures in response to increased flood risk
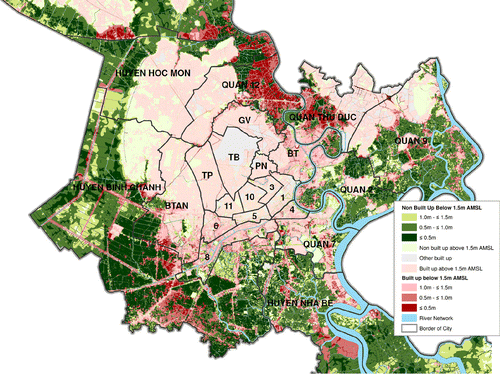
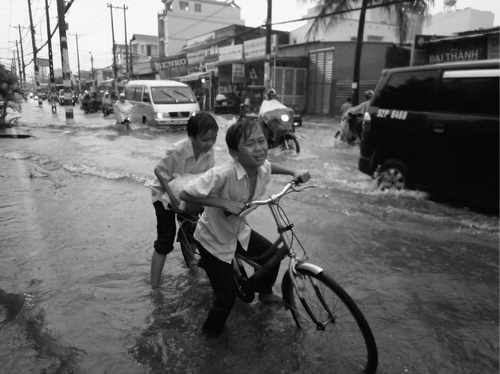
Figure 4 HCMC's non-built-up and built-up areas in flood-risk areas (areas below the current high-tide level of 1.5 m AMSL) mapped on land-use planning blocks. Source:Author's own.
Figure 5 Photograph of a localized flash flood event following heavy rainfall in Nguyen Duy Trinh Street, District 2 of HCMC on 1 October 2012. The cause of the serious flooding was two separate rainfall events of 60.6 mm and 76 mm coinciding with a high tide event of up to 1.5 m. Source: Author's own.
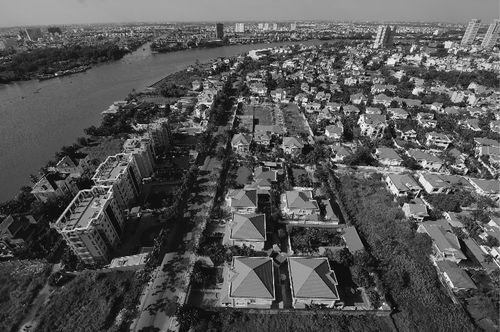
Figure 6 Photograph of the new residential area of Thao Dien Ward in district 2. Recent luxury villa and apartment extensions of the city into low-lying riparian areas of the city. Source: Author's own.
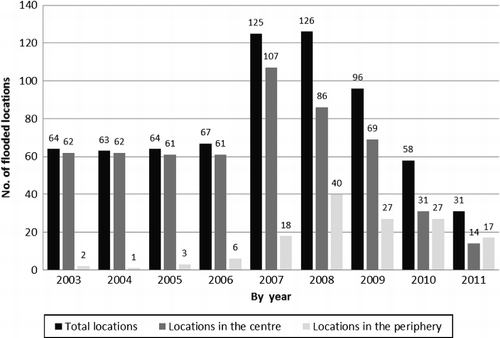
Figure 7 Number of flooding locations in the central and periphery districts of HCMC between 2003 and 2011. Source: SCFC HCMC (2011).

Reprints and Corporate Permissions

Please note: Selecting permissions does not provide access to the full text of the article, please see our help page How do I view content?

To request a reprint or corporate permissions for this article, please click on the relevant link below:

Academic Permissions

Please note: Selecting permissions does not provide access to the full text of the article, please see our help page How do I view content?

Obtain permissions instantly via Rightslink by clicking on the button below:

If you are unable to obtain permissions via Rightslink, please complete and submit this Permissions form. For more information, please visit our Permissions help page.