Figures & data
Figure 1. Analytical model to capture the values created by bottom-up urban development initiatives.
Figure 2. Hypothetical impact pathway of bottom-up urban development initiatives.
Figure 3. Case 1 and subcases 1.1, 1.2 and 1.3 in Rotterdam.
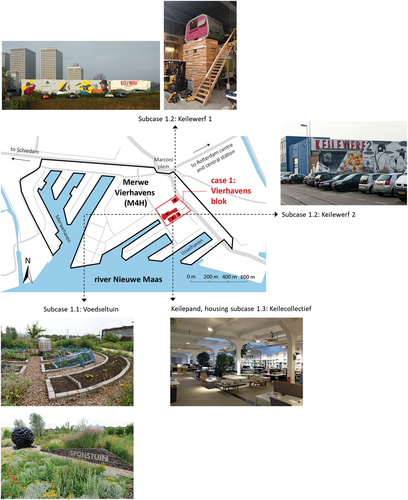
Figure 4. Case 2 and subcases 2.1 and 2.2 in Utrecht (subcase 2.3, Vriendinnen van Cartesius, is not physically located in WSK).
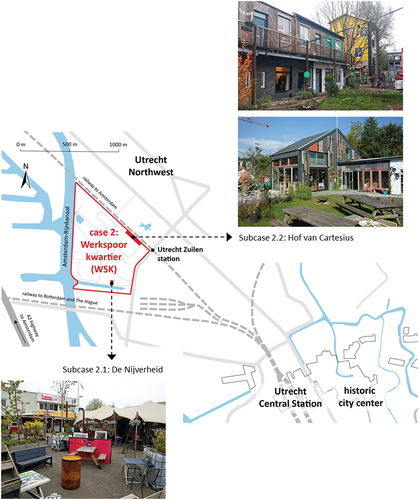
Table 1. Combined output-map of subcases 1.1, 1.2, 2.1 and 2.2 (i.e. physical developments).
Table 2. Combined output-map of subcases 1.3 and 2.3 (i.e. non-physical developments).
Table 3. Combined outcome-map of all subcases.
Table 4. Combined impact-map of all subcases.
Figure 5. Empirical impact pathways.