Figures & data
Table I. Demographics and clinical characteristics for TBI– and TBI+ groups (n = 71).
Table II. TBI characteristics according to the WARCAT.
Figure 1. (a) Concentrations of Aβ40 were significantly different (F1,68 = 6.948, p = 0.009), with higher concentrations in the TBI+ group compared to TBI– controls. (b) Concentrations of Aβ42 tended to be different (F1,64 = 2.979, p = 0.089), with a tendency to have higher concentrations in the TBI+ group compared to TBI– controls.
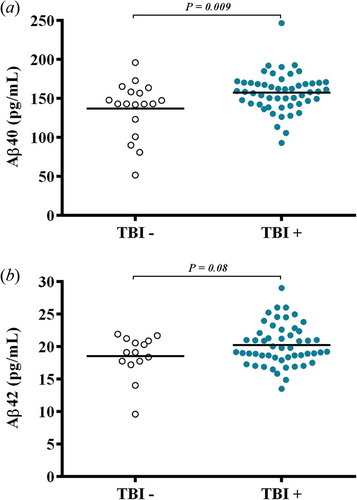
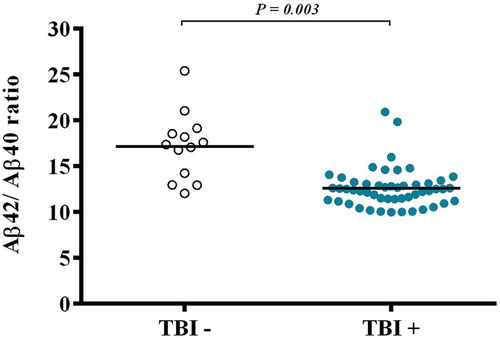
Figure 2. The ratio of Aβ42/Aβ40 was also significantly different between the groups (F1,62 = 5.671, p = 0.020), with the ratio being significantly lower in the TBI+ group compared to TBI– controls.