Figures & data
Table 1. Participating patients and control subjects from both sites.
Figure 1. (a) The Reference Brain Network Model (RBNM) is displayed in a time-collapsed figure. A coloured circle at a specific electrode denotes activity recorded from a specific recording channel. Grey-shaded lines connect a pair of events/electrodes. (b) Reference group average ERP (N100 and P200). The coloured panel has 120 rows, one for each subject. In each row, the average activity of each subject is presented for the duration of the recorded epoch. Cool and warm colours represent negative and positive values, respectively. Vertical lines in the top panel represent the minimal (left) and maximal (right) permitted latency limits of the electrode activity within the pattern.
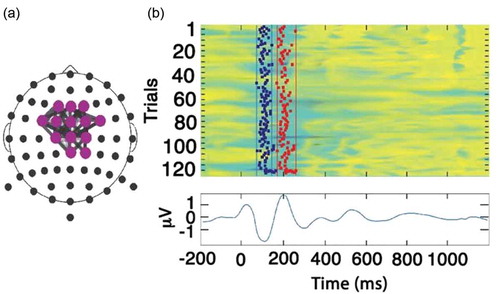
Figure 2. Discrimination between the total symptom score (y-axis) of subjects in the concussion group (grey dashed line) and those in the control group (solid black line) across visits (x-axis). Vertical lines denote the standard error. ∗∗∗p < 0.0001.
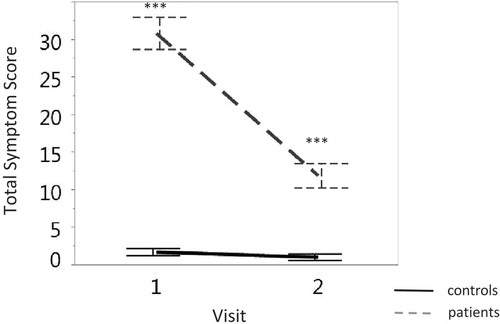
Figure 3. A 2 × 2 matrix displaying the discrimination between subjects in the concussion and control groups along two-dimensions: age (rows) and symptom severity (columns). The greatest effect emerges at the older group (> 16) with severe symptoms (right lower panel). In each of the four panels, the discrimination between the BNA score (y-axis) of subjects in the concussion (grey dashed) and control (solid black line) groups across visits (x-axis) is displayed. Vertical lines denote the standard error. Significant differences in group data are marked with ∗p < 0.05 and ∗∗p < 0.01. +, a trend toward significance.
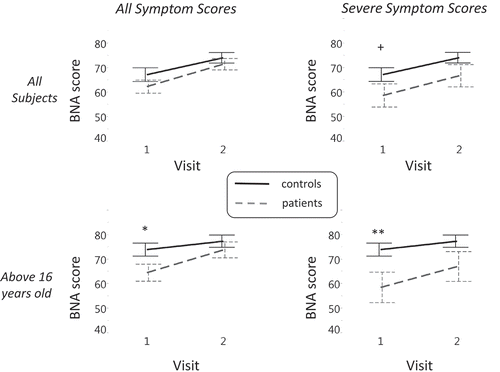
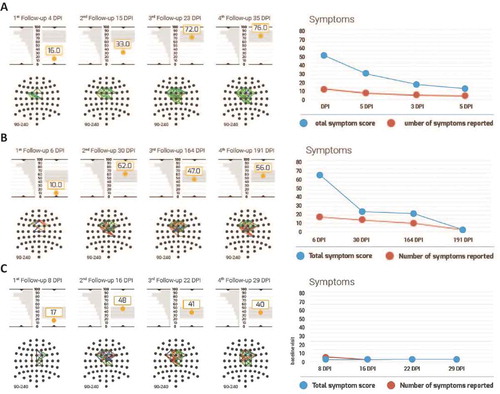
Figure 4. Individual BNA scores and symptoms of three representative patients. (a–c) Data for reported cases 1–3, respectively. In each panel, BNA data are presented on the left hand side and symptom scores are depicted on the right hand side. BNA results include the BNA scores at each visit to the clinic, below which the individual BNA network is shown. The BNA scores are shown along with the 1 SD margins of expected intra-visit variability (see Methods) as a grey rectangle. This 1 SD margin is centred around the score of the last available visit in order to facilitate the clinician’s evaluation of BNA stabilization (if the score remains within the 1 SD expected variance margins for two consecutive visits, the BNA may suggest a stabilization). To the left of each score is the first visit of the test–re-test data (i.e. the ‘test’), which is tilted vertically such that the score’s graph y-axis is also the distribution’s x-axis. Finally, the symptom score graph at the right hand side represents the number of total symptoms in red and the total symptom score in blue.