Figures & data
Table 1. Scores obtained in the rivermead post-concussion symptoms questionnaire (RPQ): a specific 16-item questionnaire that measures cognitive, emotional and physical symptoms. The patients symptoms during the last 24 hours are compared to before the traumatic brain injury, rating the responses of each item using a 5-point Likert scale as follows: 0 = not experienced at all; 1 = no more of a problem; 2 = a mild problem; 3 = a moderate problem; and 4 = a severe problem. Hospital anxiety (a) and depression scale (d) (had) consists of 14 items detecting states of depression (7 items) and anxiety (7 items, rated on a 4-point scale from 0 to 3:00 no symptoms, and 3 = a severe symptom or symptoms most of the time. The Glasgow Coma Scale (GCS) scores, ranging from 3 to 15, assess the level of consciousness based on eye, verbal and motor responses. Patients with a GCS score of 13–15 are classified as mild TBI, GCS score of 9–12 as moderate TBI or GCS score of 3–8 as severe TBI.
Figure 1. Neuropsychological tests.
Figure displays the results from (a) CVLT and (b) Stroop tests. Error bars denote standard errors. Note that there is a highly significant improvement in the two training groups for the CVLT test (a), while the Stroop test (b) showed a significant improvement only for control groups, irrespective of training.
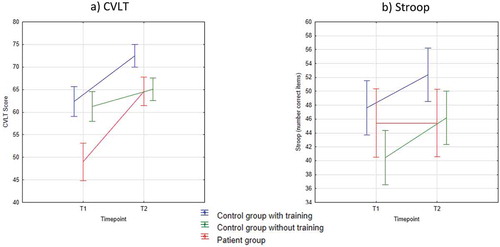
Table 2. Patient group: Scores pre-post intervention neuropsychological tests including training-time during 8 weeks intervention.
Table 3. fMRI results for the two conditions as conjunction across group means. Table describes areas of activation in terms of anatomical localisation, MNI coordinates, as well as t-statistics and cluster size with related FWE corrected p-values.
Figure 2. Pitch discrimination task.
Figure displays the results from a conjunction across group means, with a threshold of FWE-corrected threshold of p(FWE) <0.05.
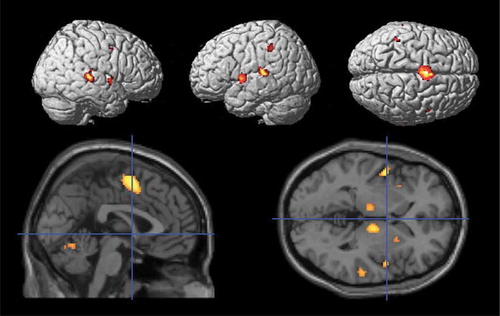
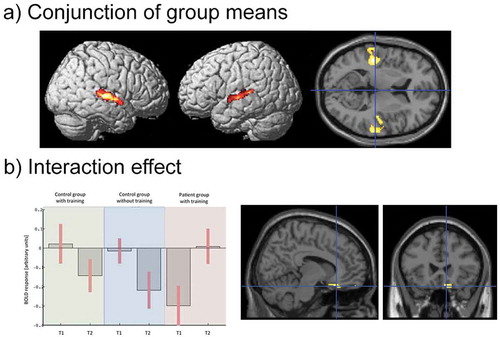
Figure 3. Tonika-dominant-tonika task.
(a) Figure displays the results from a conjunction across group means, with a threshold of FWE-corrected threshold of p(FWE) <0.05.(b) Figure displays BOLD response and localisation of significant the group × repetition interaction effect (p(FWE) <0.05). For display purpose, the threshold is set to p < 0.001