Figures & data
Table 1. Athlete demographics and characteristics.
Table 2. Biomarker values across groups.
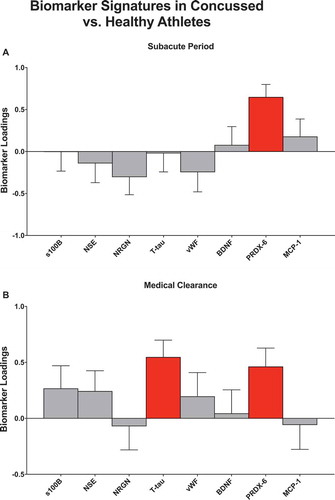
Figure 1. Biomarker variance between concussed and healthy athletes. s100 calcium binding protein beta (s100B); glial fibrillary acidic protein (GFAP); neuron specific enolase (NSE); neurogranin (NRGN); creatine kinase-BB isoenzyme (CKBB); visinin-like protein (VILIP-1); von Willebran factor (vWF); brain derived neurotrophic factor (BDNF); peroxiredoxin (PRDX) − 6; monocyte chemoattractant protein (MCP) −1. Plots show the contributions of individual biomarkers towards class separation between concussed and healthy athletes at (a) the subacute period after injury, and (b) medical clearance, by PLS-DA analysis. Bars represent biomarker loadings and the standard error derived from bootstrapped resampling (1000 samples). red bars = FDR < 0.05.