Figures & data
Table 1. Patients’ demographics
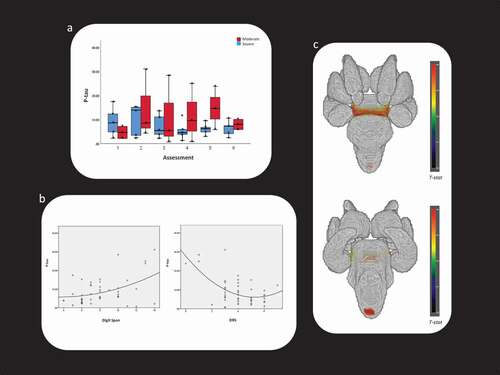
Figure 1. Behavioral and neuroimaging findings related to P-tau
Legend. Panel A illustrates changes of P-tau across time-points in moderate and severe TBI (line = median, box = interquartile range, whiskers = minimal/maximal value, asterisk = data point); Panel B illustrates the relation between P-tau and outcome measures (i.e., Digit Span subscale of the RBANS, on the left, and the Disability Rating Scale-DRS, on the right); Panel C illustrates the association between P-tau and longitudinal shape change in brainstem.