
Figures & data
Table 1. Demographic information of the participants with TBI.
Table 2. Correlations between individual z-scores of EF tasks and the EF composite score.
Table 3. Whole-brain VBM analysis.
Table 4. Group differences in EF and SA-related brain regions.
Figure 1. Differences in EF-related brain regions.
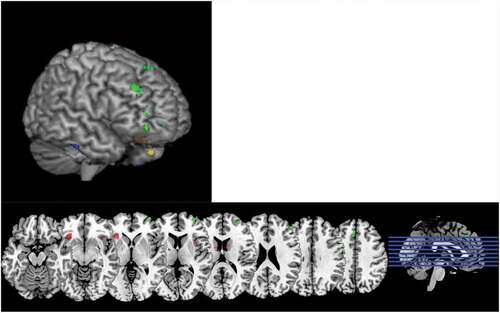
Figure 2. Differences in SA-related brain regions.
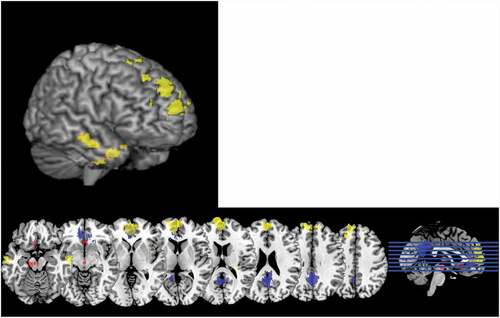
Table 5. Correlations between EF-related regions & SA-related regions.
Table 6. Correlations between EF-related regions and neuropsychosocial measures.
Table 7. Correlations between SA-related regions and neuropsychosocial measures.
Supplemental material