Figures & data
Figure 1. PRISMA flow diagram (Moher et al., 2009).
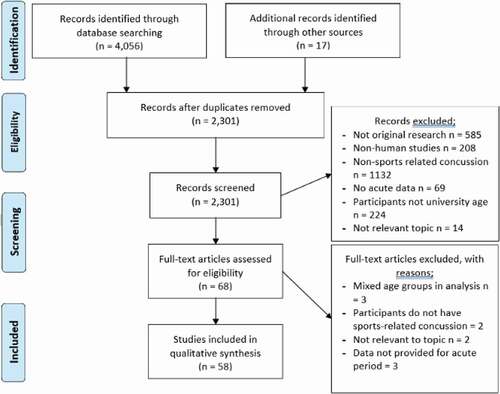
Figure 2. Mean number of days to symptom recovery for papers specifically detailing when symptom recovery occurred (sport concussion assessment tool (SCAT3), the revised head injury symptom scale (HIS-R), immediate post concussion and cognitive test (impact), graded symptom checklist (GSC). method of recovery definition by either being asymptomatic, returning to baseline, medically cleared or within one reliable change index to baseline. Participant groupings; immediate removal from activity (I-RFA), Delayed removal from activity (D-RFA)).
Figure 3. Symptom score change from baseline on immediate post concussion assessment and cognitive test (impact).
Figure 4. Sport concussion assessment tool (scat) symptom score change from baseline.
Figure 5. Mean number of days for neurocognitive recovery. (standardised assessment for concussion (sac), immediate post-concussion and cognitive test (impact), vs controls = athletes with concussion compared to controls, no impairment = deemed recovered when test scores had returned to baseline, x axis = hours post sports-related concussion).
Figure 6. Mean score change post sports related-concussion for standardised assessment for concussion (SAC) (x axis = hours post sports-related concussion).