Figures & data
Table 1. Characteristics of included controls, athletes with repetitive sports-related concussion (rSRC) and traumatic brain injury (TBI) patients. Mean values, standard deviations and p-values are shown. CI = confidence interval; SCAT = sport concussion assessment tool; # = number; SSS = symptom severity score; NOS = number of Symptoms; RBANS = repeatable battery for the assessment of neuropsychological status; CT = computed tomography; MR = magnetic resonance; DAI = diffuse axonal injury; NAA = N-acetylaspartate; NAAG = N-acetylaspartylglutamate; Cr = creatine; GM = gray matter; WM = white matter; a.u. = arbitrary unit. *significantly lower when compared to controls.
Figure 1. The location of the examined voxels using 3 T magnetic resonance spectroscopy. A-C show position of the white matter voxel and D-F shows voxel position in the gray matter.
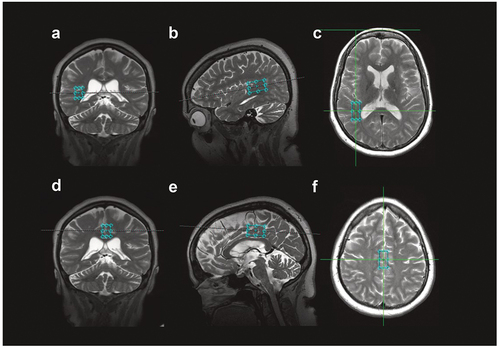
Figure 2. illustration of the cerebral parcellation using the software freesurfer (http://surfer.nmr.mgh.harvard.edu) used to divide the pseudo-continuous ASL(pCASL) data into total gray and white, the former divided into 20 gray matter regions, providing a mean cerebral blood flow (CBF) value for each region. Two scans were performed on each study participant, and the mean of the two scans was calculated for each region in each subject. The mean value, standard deviation and confidence interval for each region and each group are shown in . a. amygdala, b. total grey matter, c. total white matter, d. caudate nucleus, e. frontal lobe gray mater, f. hippocampus, g. occipital lobe gray matter, h. globus pallidum, i. parietal lobe gray matter, j. putamen, k. temporal lobe gray matter, l. thalamus.
Table 2. Comparison between male and female controls, rSRC athletes and TBI patients. No statistical comparisons of male and female TBI patients were made due to the low number of cases. In all measured aspects, there were no sex differences in the control and rSRC groups. Means and standard deviations are shown. rSRC = repeated sports-related concussions; TBI = traumatic brain injury; # = number; RBANS = Repeated battery assessment of neurological status; MRS = magnetic resonance spectroscopy; GM = grey matter; WM = white matter; CR = creatine; NAA = N-Acetylaspartate; NAAG = N-acetylaspartylglutamate; a.u. = arbitrary unit; mm = millimeter; § = due to low number of female TBI patients median and range is shown.
Table 3. Cerebral blood flow (CBF; in ml/100 gm/min) in total gray and white matter, the gray matter divided into 20 different brain regions, presented for all controls and TBI patients. For the rSRC athletes and controls, males and females are presented separately. Each evaluated brain region corresponds to a gray matter area except the total white matter region. rSRC = repeated sports-related concussions. L = left; R = right, CI = confidence interval, F = females, M = males.
Figure 3. Global mean cortical thickness, measured in millimeter (mm). There were a significant difference in thickness between controls and TBI patients (p = 0.05 CI = 0.002–0.23), not between rSRC and TBI (p = 0.07 CI = 0.007–0.22) and not between controls and rSRC (p = 0.96 CI = −0.08–0.11). rSRC = repeated sportsrelated concussions; TBI = traumatic brain injury.
Figure 4. Mean and individual global changes in cerebral blood flow (CBF) in traumatic brain injury (TBI) patients and athletes symptomatic following repeated sport related concussion (rSRC) showing decreased CBF in both white and gray matter. furthermore, CBF is lower in female athletes with rSRC when compared to female healthy controls, findings not observed in the male athletes. In view of the limited number of female TBI patients, we refrained from analyzing sex differences in this group. Horizontal bars indicate the mean values. F = females. M = males.