
Figures & data
Table 1. Demographic and injury information for participants with TBI.
Figure 1. Example stimuli for each of the three emotion recognition conditions. In the face condition, each emotion was depicted by four different actors. In the emoji conditions, each emotion was depicted by four different platforms, with iOS 14.2 renderings pictured here. .
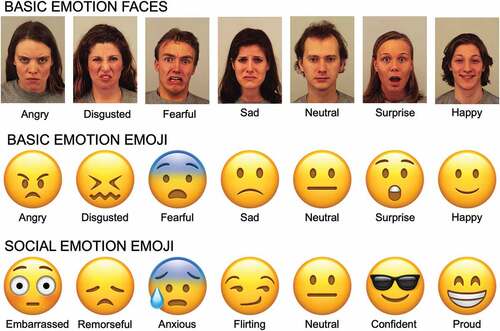
Figure 2. Proportion of correct emotion labels for each of the three stimulus conditions by group. Points indicate mean performance of individual participants. Bars represent standard error of the mean.
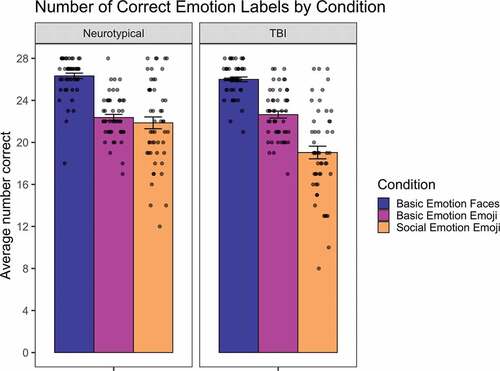
Table 2. Confusion Matrix Demonstrating Proportion of Basic Emotions Depicted by Faces Correctly and Incorrectly Labeled by Neurotypical Participants and Participants with TBI.
Figure 3. Proportion of correct labels for each emotion type for each stimulus condition and participant group.
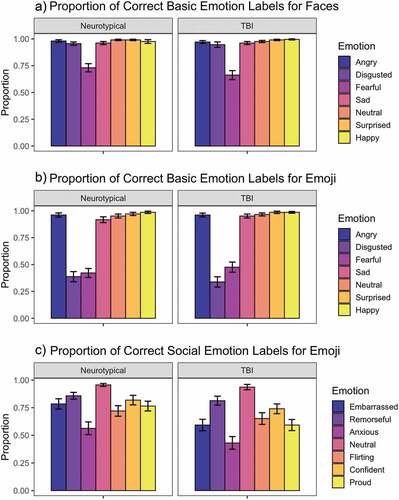
Table 3. Confusion Matrix Demonstrating Proportion of Basic Emotions Depicted by Emoji Correctly and Incorrectly Labeled by Neurotypical Participants and Participants with TBI.
Table 4. Confusion Matrix Demonstrating Proportion of Social Emotions Depicted by Emoji Correctly and Incorrectly Labeled by Neurotypical Participants and Participants with TBI.