
Figures & data
Table 1. Distribution of age and sex among players who just play a match.
Table 2. Descriptive Statistics for players with a head injury and control players separated by Sex. The mean and standard deviation for the classified players with a head injury and control players are reported.
Figure 1. SCAT3 Components in players with a head injury and control players. Depicts the total number of symptoms (Z = −7.61, P < 0.001), total symptom severity (Z = −7.89, P < 0.001), SAC total (Z = −2.46, P = 0.007), and BESS total (Z = −0.32, P = 0.739) among players with a head injury and control players. Mann-Whitney U results for the SCAT3 components.
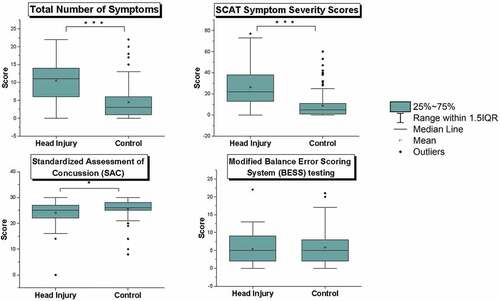
Table 3. Table 3 Mann-Whitney U-Test results for the SCAT3 components in players with a head injury and control players.
Figure 2. Principal Component Analysis: An illustration of the factor clusters. 4 factor solutions derived from the SCAT3 symptom ratings performed by rugby players who just played a match. Refer to Supplemental Table 2 for detailed factor loadings. Cross-loading symptoms are bolded.
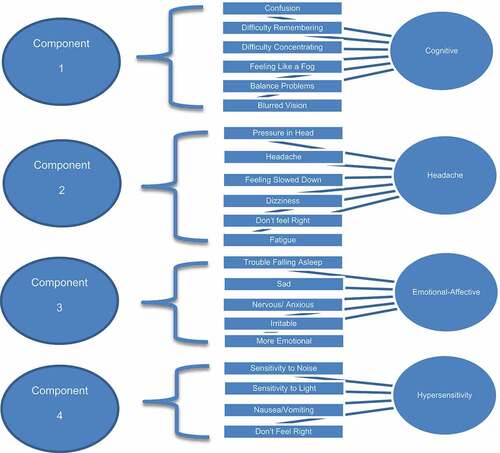
Figure 3. Depicts the mean scores of the 4 symptom clusters: a) Headache (Z = 8.66, P < 0.001);, b) Hypersensitive (Z = 4.64, P < 0.001); c) Cognitive-Sensory (Z = 7.14, P < 0.001), and d) Emotional Affective (Z = 3.29, P = 0.001) among the identified control and players with a head injury. Mann-Whitney U results for the SCAT3 Symptom Clusters.
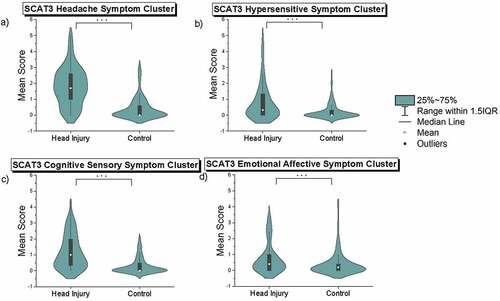
Table 4. Regression analysis was performed on the 4-factor solution derived from the SCAT3 symptom ratings to identify which factors are predictive of players who experienced an injury to the head.