
Figures & data
Figure 1. PRISMA Flow Diagram of the study selection process. A total of 1,310 studies were evaluated for rural/urban differences in patients with brain trauma. After title and abstract screening, 90 full-text articles were reviewed, 36 of which were included in the systematic review and meta-analysis after exclusions. CINAHL, Cumulative Index of Nursing and Allied Health; EBSCO, Elton B. Stephens Company; MOI, mechanism of injury.
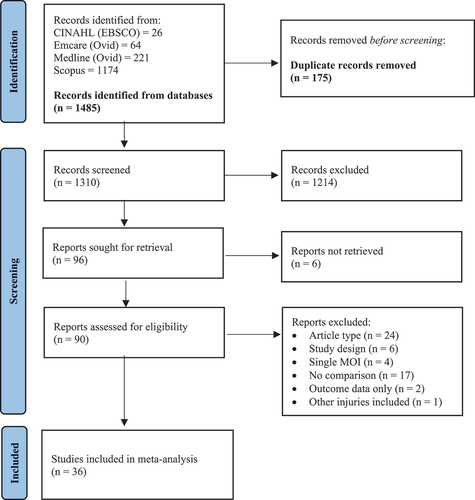
Table 1. Study characteristics and quality assessment.
Figure 2. Forest plot demonstrating the mean difference in age (years) calculated using the random effects model. There was no statistical difference in age between rural and urban patients with brain trauma (MD: 1.10; 95% CI − 3.17, 5.37; p = 0.61). Mean [SD] for Stewart 2014 (Citation37) was calculated using the methodology of Wan et al (Citation25). SD, standard deviation; CI, confidence interval; I2, test of heterogeneity; MD, mean difference.
![Figure 2. Forest plot demonstrating the mean difference in age (years) calculated using the random effects model. There was no statistical difference in age between rural and urban patients with brain trauma (MD: 1.10; 95% CI − 3.17, 5.37; p = 0.61). Mean [SD] for Stewart 2014 (Citation37) was calculated using the methodology of Wan et al (Citation25). SD, standard deviation; CI, confidence interval; I2, test of heterogeneity; MD, mean difference.](/cms/asset/574a549e-fc98-4475-86c4-715d0f54246d/ibij_a_2361641_f0002_oc.jpg)
Figure 3. Forest plot demonstrating the odds ratio of male sex in rural and urban brain trauma populations with subgroup analysis of pediatric/adolescent cohorts, adult cohorts, and studies incorporating all ages. The proportion of males suffering brain trauma was comparable across rural and urban areas, regardless of age. SD, standard deviation; CI, confidence interval; I2, test of heterogeneity.
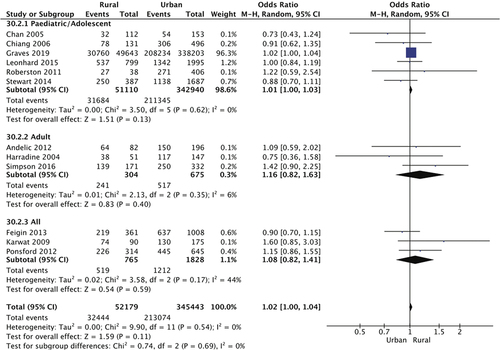
Table 2. Patient characteristics.
Table 3. Incidence Rate of Brain Trauma (/100,000 persons) in Rural and Urban Populations.
Figure 4. Forest plot demonstrating the odds ratio of transport being the cause of brain trauma in rural and urban populations with subgroup analysis of pediatric/adolescent cohorts, adult cohorts, and studies incorporating all ages. Overall, rural residents were significantly more likely to suffer brain trauma resulting from transport accidents, particularly those in pediatric and adolescent age groups (OR: 1.62; 95% CI 1.33, 1.98; p < 0.00001). CI, confidence interval; I2, test of heterogeneity; OR, odds ratio.
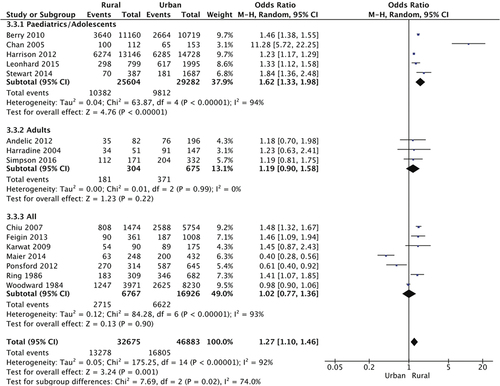
Figure 5. Forest plots showing types of transport accidents causing traumatic brain injury in rural and urban populations. (A), Car; (B), Pedestrian; (c), Other motorized vehicle; (D), Bicycle. Pedestrian-related brain injuries were 64% more likely in urban environments (p = 0.008), whereas motorized vehicles such as all-terrain vehicles, quad bikes, and motorcycles, were responsible for more injuries in rural areas (OR: 3.63; 95% CI 1.58, 8.35; p = 0.002). CI, confidence interval; I2, test of heterogeneity; OR, odds ratio.
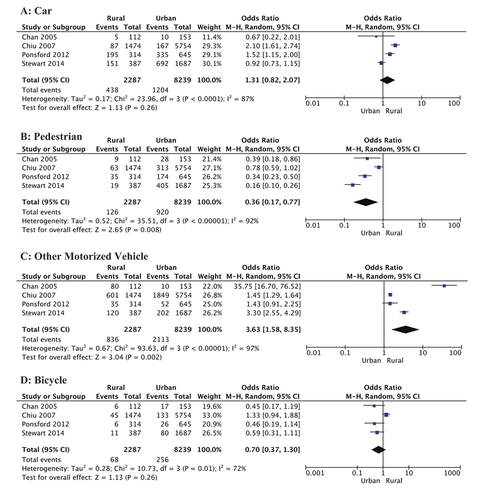
Figure 6. Forest plot demonstrating the odds ratio of falls being the cause of brain trauma in rural and urban populations with subgroup analysis of pediatric/adolescent cohorts, adult cohorts, and studies incorporating all ages. Overall, urban residents were 27% more likely to suffer brain trauma resulting from falls (p < 0.00001). The odds of fall-induced brain trauma was significantly less in rural children and adolescents (OR: 0.65; 95% CI 0.52, 0.81; p < 0.0002). CI, confidence interval; I2, test of heterogeneity; OR, odds ratio.
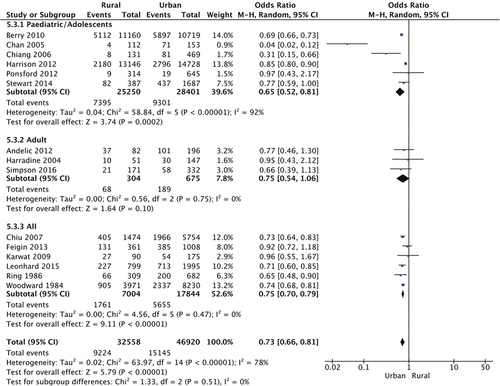
Figure 7. Forest plot demonstrating the odds ratio of assault being the cause of brain trauma in rural and urban populations with subgroup analysis of mild, severe, and injury severities. Overall, assault-related brain injury was comparable across rural and urban populations, except mild brain injuries caused by assault which were ~ 50% less likely in rural areas (p = 0.03). CI, confidence interval; I2, test of heterogeneity.
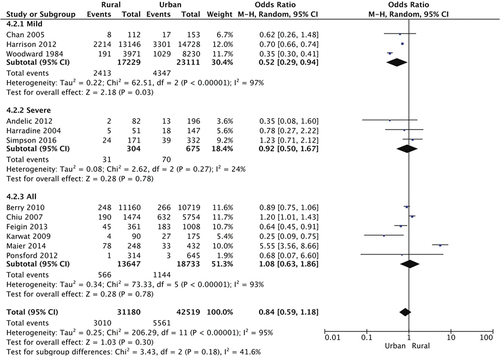
Figure 8. Forest plots showing no difference in (A) sports-related and (B) other causes of brain trauma in rural and urban populations. Other causes included exposure to animal and inanimate mechanical forces, work-related accidents, and use of firearms. CI, confidence interval; I2, test of heterogeneity.
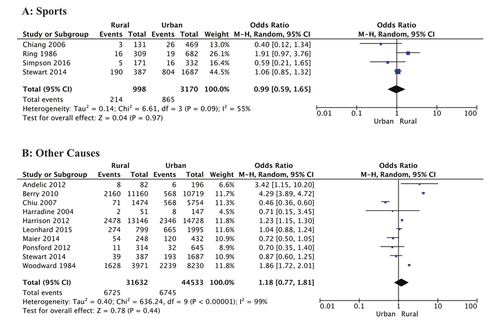
Figure 9. Forest plots showing measures of brain injury severity in rural and urban populations. (A), Proportion of severe brain injury (GCS 3–8); (B), GCS (mean [SD); (C), Normal CT findings; (D), CT-diagnosed skull fracture; (E), CT-diagnosed ICH. Rural residents were significantly more likely to suffer severe brain trauma (OR: 1.28; 95% CI 1.04, 1.58; p = 0.02), and less likely to have a normal CT (OR: 0.52; 95% CI 0.41, 0.67; p < 0.00001). Mean [SD] GCS for Harradine 2004 (Citation39) was calculated using the methodology of Wan et al (Citation25). GCS, Glasgow Coma Scale; CT, computed tomography; ICH, intracranial hemorrhage; CI, confidence interval; I2, test of heterogeneity; OR, odds ratio.
![Figure 9. Forest plots showing measures of brain injury severity in rural and urban populations. (A), Proportion of severe brain injury (GCS 3–8); (B), GCS (mean [SD); (C), Normal CT findings; (D), CT-diagnosed skull fracture; (E), CT-diagnosed ICH. Rural residents were significantly more likely to suffer severe brain trauma (OR: 1.28; 95% CI 1.04, 1.58; p = 0.02), and less likely to have a normal CT (OR: 0.52; 95% CI 0.41, 0.67; p < 0.00001). Mean [SD] GCS for Harradine 2004 (Citation39) was calculated using the methodology of Wan et al (Citation25). GCS, Glasgow Coma Scale; CT, computed tomography; ICH, intracranial hemorrhage; CI, confidence interval; I2, test of heterogeneity; OR, odds ratio.](/cms/asset/40318f1d-2cfe-4f10-99d3-00952cf88be7/ibij_a_2361641_f0009_oc.jpg)
Figure 10. Forest plots showing clinical symptoms after brain injury in rural and urban populations. (A), LOC/ALOC; (B), Headache; (C), Seizures; (D), Nausea/Vomiting. Rural residents were five-fold more likely to suffer loss of, or altered, consciousness (p = 0.04). Incidence of headache, seizures, and nausea or vomiting was similar in patients from rural and urban areas. LOC, loss of consciousness; ALOC, altered level of consciousness; CI, confidence interval; I2, test of heterogeneity.
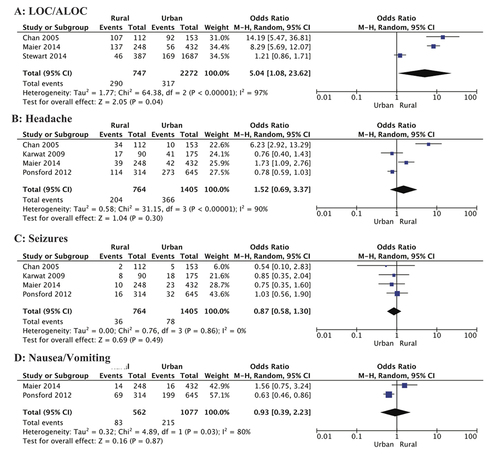
Figure 11. a, Forest plot showing mortality incidence in rural and urban brain trauma populations calculated using the random effects model. Mortality was comparable across rural and urban areas. b, Funnel plot of publication bias. CI, confidence interval; I2, test of heterogeneity.
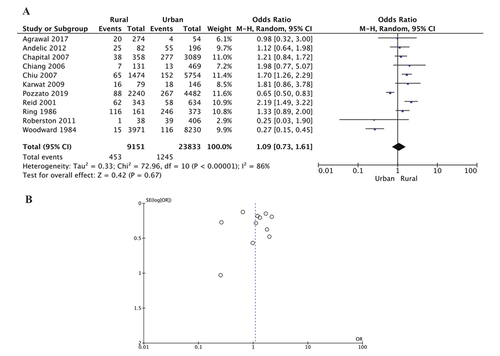
Table 4. Brain Trauma Mortality Rate in Rural and Urban Populations.
Figure 12. Forest plots showing outcomes after brain injury in rural and urban populations. a, Vegetative/severe disability; b, Good recovery; c, Length of hospital stay (days); d, Employed post-injury. Urban residents were more likely to have a good recovery (p = 0.003), and reduced hospital stay, however this difference was not statistically significant (MD: −3.23; 95% CI − 10.08, 3.63; p = 0.36). Mean [SD] LOS for Harradine 2004 (Citation39) and Reid 2001 (Citation34) was calculated using the methodology of Wan et al (Citation25). LOS, length of stay; CI, confidence interval; I2, test of heterogeneity; MD, mean difference.
![Figure 12. Forest plots showing outcomes after brain injury in rural and urban populations. a, Vegetative/severe disability; b, Good recovery; c, Length of hospital stay (days); d, Employed post-injury. Urban residents were more likely to have a good recovery (p = 0.003), and reduced hospital stay, however this difference was not statistically significant (MD: −3.23; 95% CI − 10.08, 3.63; p = 0.36). Mean [SD] LOS for Harradine 2004 (Citation39) and Reid 2001 (Citation34) was calculated using the methodology of Wan et al (Citation25). LOS, length of stay; CI, confidence interval; I2, test of heterogeneity; MD, mean difference.](/cms/asset/b14ee120-f727-45b2-9764-e6c97889b908/ibij_a_2361641_f0012_oc.jpg)
Table
Data availability statement
This systematic review and meta-analysis is a synthesis of existing published data, openly available in cited references.