Figures & data
Table 1. Mean and standard deviation values for each of the three vowels/a/,/i/and/u/as produced by the CAS and TYP children of the study, two groups of adult Italian speakers (males and females) and a group of typically developing Italian children. Details about the source data are given in the text
Figure 1. F1 standard deviation values as a function of vowel and speaker. Dark grey = CAS speakers (from cas01 to cas05, left to right), light grey = TYP speakers (from typ01 to typ05, left to right). Average group values (white bars with dark and light grey lines for, respectively, CAS and TYP groups) are also reported for each vowel

Figure 2. F2 standard deviation values as a function of vowel and speaker. Dark grey = CAS speakers (from cas01 to cas05, left to right), light grey = TYP speakers (from typ01 to typ05, left to right). Average group values (white bars with dark and light grey lines for, respectively, CAS and TYP groups) are also reported for each vowel
Figure 3. WS distance values as a function of vowel and speaker. Dark grey = CAS speakers (from cas01 to cas05, left to right), light grey = TYP speakers (from typ01 to typ05, left to right). Average group values (white bars with dark and light grey lines for, respectively, CAS and TYP groups) are also reported for each vowel
Table 2. VSA values for each speaker and mean values for groups
Figure 4. Normalised F1× F2 VSAs for CAS (left panel) and TYP children (right panel)
Figure 5. Smoothing splines of tongue shapes in the production of CAS speakers
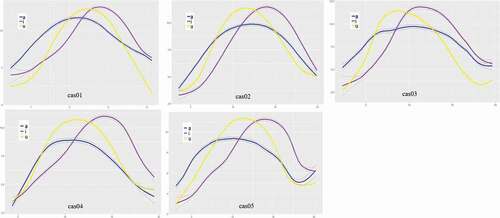
Figure 6. Smoothing splines of tongue shapes in the production of TYP speakers
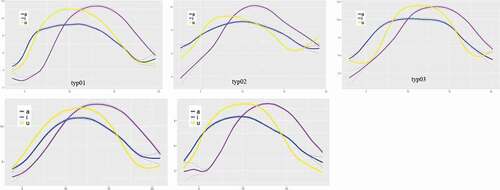
Figure 7. In each box, the tongue tip is on the right and the tongue back in on the left. When the confidence interval encompasses the zero on the y axis at any point along the interaction curve, there is no difference between the two curves being compared; the interaction at that point is not statistically significant (Davidson, Citation2006)