Figures & data
Table 1. Demographic details and assessment scores
Table 2. Prompt rates in syllables per second from McCann and Wrench (Citation2007)
Figure 1. Ultrasound equipment (L) and headset (R). Note: Photograph on left copyright articulate instruments, reproduced with permission. Photograph on right copyright Joanne Cleland, reproduced with permission.
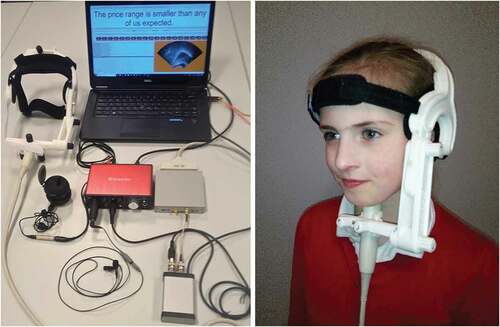
Figure 2. Screen shot of AAA software showing ultrasound image and spectrogram.
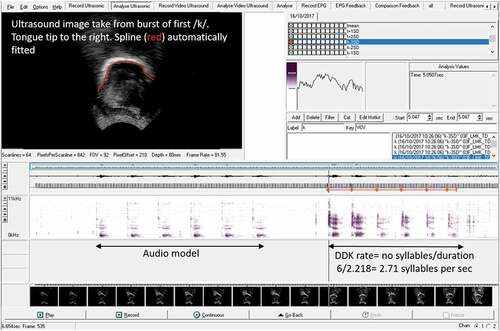
Figure 3. Example mean tongue curves from /p/ at slow (red) and fast (green) rates with standard deviations in dotted lines. A zone of significantly different radii are shown as green spokes on the arc. In this example 7 consecutive radii have an average radial difference of 1.5 mm.
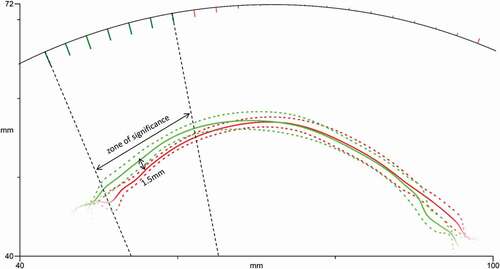
Table 3. Maximum rate in syllables per second
Table 4. Accuracy
Table 5. % consistent
Table 6. Articulatory t-test results comparing tongue shapes at slowest and fastest rates
Figure 4. Percentage of each group with significant tongue-shape differences in slow versus fast productions.
Table 7. Standard deviations of tongue-shapes at slow and fast rates in mm
Figure 5. Mean standard deviations for single, bi- and tri-syllables in both groups.