Figures & data
Table 1. Demographic information of the children with hearing loss (CHL), children with normal hearing (CNH) and their parents.
Table 2. Individual descriptive data of the children with hearing loss (CHL).
Table 3. The Swedish consonant system presented in order of developmental acquisition and divided by sound class (Bjar, Citation2011).
Figure 1. Percentage of children in each group using oral stops, and dental/alveolar stops at 10 and 18 months of age. At 10 months: CHL and CNH (n = 11) respectively and at 18 months: CHL and CNH (n = 10) respectively. P-values from Fisher's exact test (*p < 0.01, **p < 0.05).
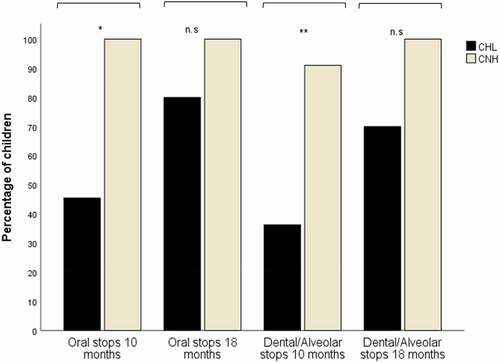
Figure 2. Number of different true consonants at 10 and 18 months and number of established consonants at 36 months (max 10) in the CHL (P1-11) and the mean number of the group of CNH (n = 11) at the corresponding ages. The median number of different true consonants of the CNH group are adjusted to fit the figure (real numbers at 10 months = 1.3 and 18 months = 5.8). Data is missing for P4 at the age of 36 months and for P5 at 18 and 36 months, others being “0”.
Figure 3. Proportion of children with hearing loss (CHL) and children with normal hearing (CNH) who had established consonants at 10, 18, and 36 months. The number of children in each group at 10 months were (n = 11), at 18 months (n = 10) and at 36 months the CHL were (n = 9) and the CNH (n = 10).