
Figures & data
Figure 1. Example ultrasound images from a typical child speaker for n (left) and ŋ (right) with the tongue tip facing to the right.
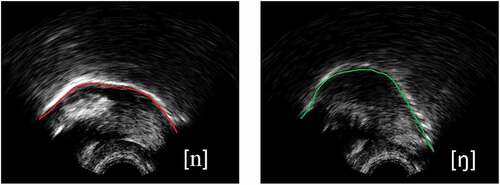
Table 1. Assessment and treatment schedule
Table 2. Andrew’s error pattern analysis for /n/ tokens in single words *N.B brackets indicate the number of occurrences
Figure 2. Mean midsagittal tongue surface curves of /n/ (green) /ŋ/ (purple) from minimal pair probes in assessment sessions one to six (tongue tip to the left, on a 1 cm grid, with a 22.5° rotation). Co-radial solid markers indicate a significant radia.
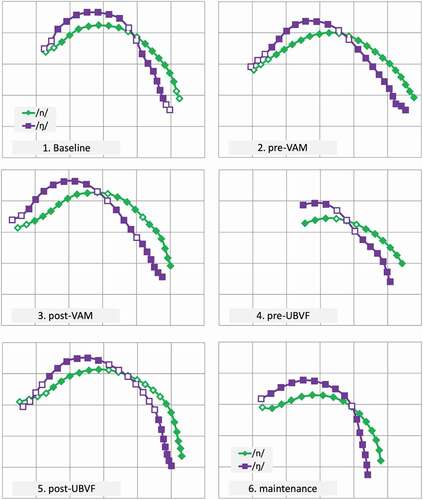
Figure 3. Proportion of the full spline pairs forming a Zone of Significance (5 or more contiguous significant different radii augmented by any cross-over and further significant radii).
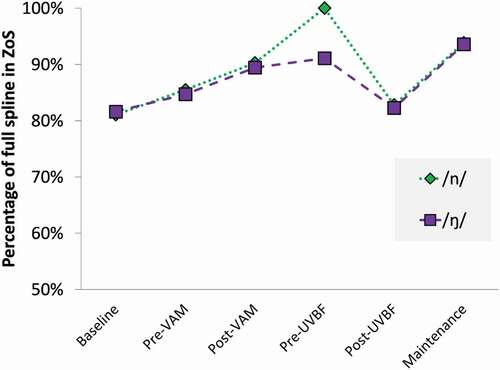
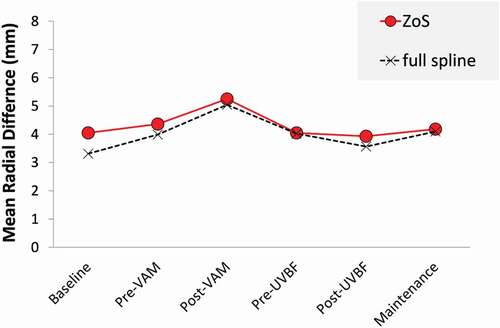
Figure 4. Mean Radial Difference between /n/ and /ŋ/, limited to ZoS (red circles) or using all the tongue spline for which both targets exceed the 80% confidence threshold (crosses).
Table
Table