Figures & data
Table 1. Detailed information for 36 speakers including Speaker ID, gender, age, etiology, dysarthria type, PhonI score (%), severity level of dysarthria (SevL; non-mild-moderate-severe), and whether the speakers were selected for the Word Experiment.
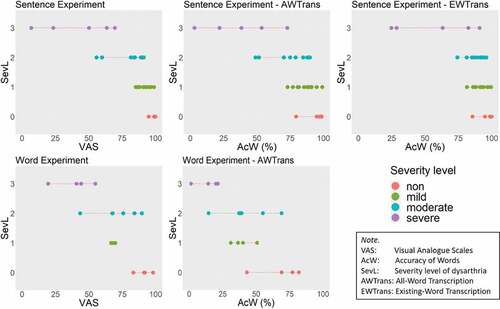
Figure 1. Distribution of speakers over four severity levels of dysarthria (SevL) in our two experiments.
Figure 2. An illustration of our online listening experiments.
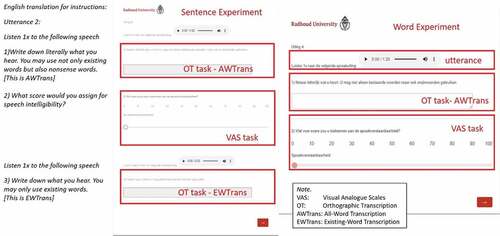
Table 2. Means (standard deviations) for the two types of intelligibility measures, VAS and AcW, in our two experiments. The results for AcW in the Sentence Experiment are denoted by All-Word Transcription (AWTrans) on the left and Existing-Word Transcription (EWTrans) on the right.
Table 3. Interrater reliability of the intelligibility measures in our two experiments based on the D-coefficient. The results for AcW in the sentence experiment are denoted by All-Word Transcription (AWTrans) on the left and Existing-Word Transcription (EWTrans) on the right.
Table 4. Interrater reliability of the intelligibility measures in the Sentence Experiment based on the Intraclass Correlation Coefficient for the four sentences, i.e. PM1, PM2, PM3 and PM4. The results for AcW in the Sentence Experiment are denoted by All-Word Transcription (AWTrans) on the left and Existing-Word Transcription (EWTrans) on the right.
Figure 3. D-coefficients for a different number of utterances and raters of scores of VAS and AcW (with two forms of transcriptions).
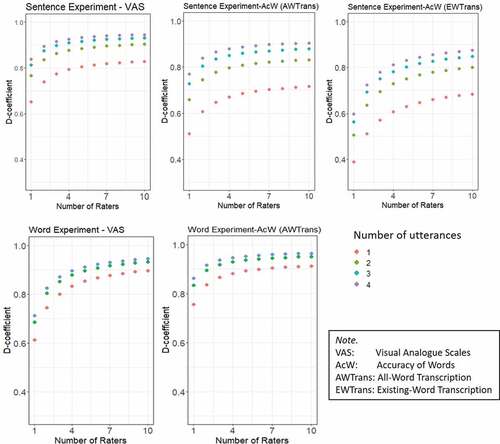
Table 5. Pearson correlations between VAS and AcW in the two experiments, with two forms of transcriptions in the Sentence Experiment.
Table 6. Pearson correlations between the external measure PhonI and our two intelligibility measures, i.e. VAS and AcW. The results for AcW in the Sentence Experiment are denoted by All-Word Transcription (AWTrans) on the left and Existing-Word Transcription (EWTrans) on the right.
Figure 4. Scattergrams, including the regression lines and their confidence intervals (95%) with distinguished SevL of the speakers, between the external measure PhonI and our two intelligibility measures, VAS and AcW (with two forms of transcriptions).
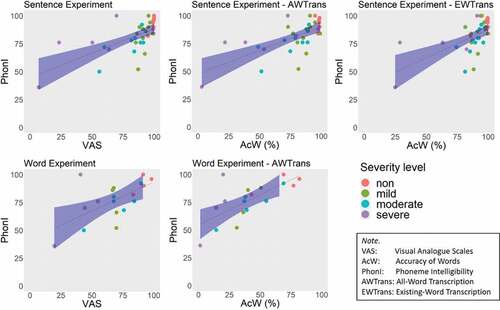
Table 7. Correlation (Nagelkerke R2s) and SevL classification (percentage of correctly classified speakers) for the external measure SevL as the criterion and one of our two intelligibility measures, VAS and AcW, as a predictor. The results for AcW in the Sentence Experiment are denoted by All-Word Transcription (AWTrans) on the left and Existing-Word Transcription (EWTrans) on the right.
Figure 5. Scattergrams between the external measure SevL and our two intelligibility measures, VAS and AcW (with two forms of transcriptions).