
Figures & data
Table 1. Speaker characteristics for the healthy control and A-AOS groups.
Table 2. Stimuli of the experiment.
Table 3. Algorithms for f0 parameters.
Table 4. Numbers of tone and vowel productions in each group.
Figure 1. f0 plots of the four tones produced by HC, PC and PI groups. The X-axes represent the normalised duration of the tone productions, while the Y-axes show the mean fundamental frequency of the pitch contours (in semitones). The rising-falling contours of two T2 and one T4 (all produced by A-AOS 9) were categorised as correct by listeners, as indicated by the red arrows.
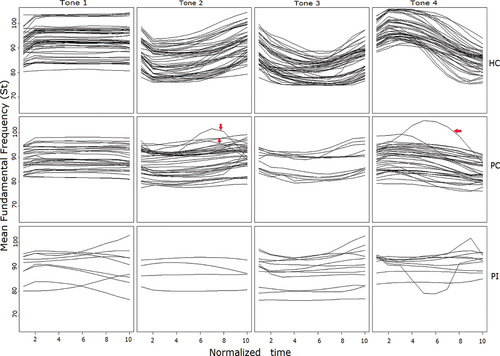
Figure 2. Average f0 plots of the four tones produced by HC, PC and PI groups. The X-axes represent the normalised time of the average tone production, while the mean fundamental frequency of the pitch contour (in semitones) is given along the Y-axis.
Table 5. Mean values of the acoustic parameters for tones and vowels.
Table 6. Results of the Kruskal-Wallis test for tones and pairwise comparisons.
Figure 3. Mean formant trajectories (F1 and F2) for each vowel uttered by different accuracy groups. The numbers 1, 2, and 3 on the X-axes represent 25%, 50%, and 75% of the vowel duration, respectively, while the Y-axes display the frequency (Hertz) value of the averaged formant trajectories.
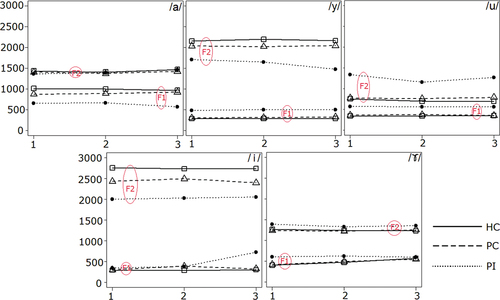
Table 7. Results of the Kruskal-Wallis test for vowels and pairwise comparisons.
Figure 4. Acoustic relationships for the three accuracy groups: left panel for tones and right panel for vowels. Line length was calculated based on the mean value of Euclidean distance of the four tones (or five vowels) between groups.
Table 8. Identification of the tones and vowels in the PI group.