
Figures & data
Table 1. Description of the percentage of participating SLPs regarding work setting, year of graduation, and the typical age range of the children in their clinic.
Figure 1. The participating SLPs’ answers regarding their view on test results, and their utilisation of test results.
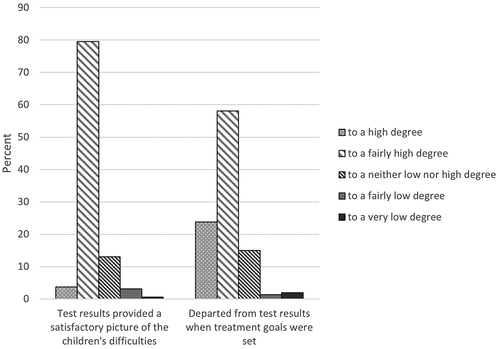
Table 2. To what extent the SLPs (in percent) experienced different phases of their practices to be in alignment with children’s everyday communication skills.
Table 3. To what extent the SLPs (in percent) experienced different phases of their practices to be in alignment with children’s everyday language skills.
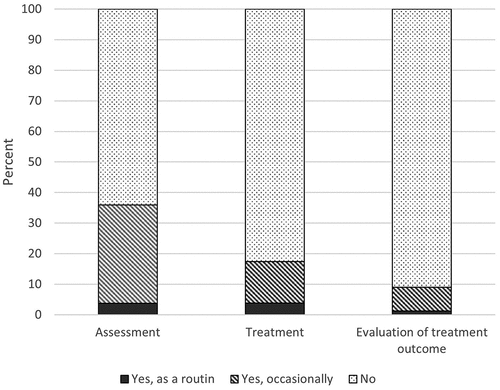
Figure 2. A summary of the SLPs’ responses when asked if they ever use video recording in clinical practice with children with (D)LD.
Supplemental material