1,672
Views
15
CrossRef citations to date
0
Altmetric
Articles

Human preferences are biased towards associative information

, , &
Pages 1054-1068 | Received 28 Apr 2014, Accepted 12 Sep 2014, Published online: 10 Oct 2014

Figures & data

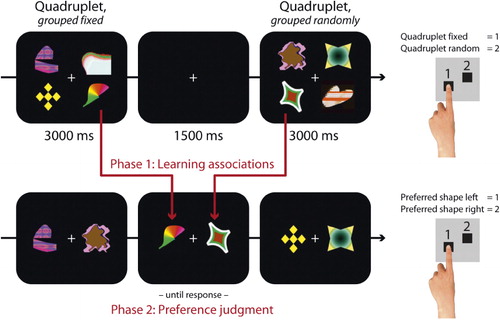
Figure 1 Experiment 1 consisted of two parts. In the first part (top), participants learned associations for arbitrary visual shapes. Fifty percent of those shapes were always grouped in the same quadruplet, and presented on the same spatial position, and 50% were randomly grouped together. The training consisted of 320 trials in total. There were 20 repetitions for each single shape in the non-associative condition, and 20 repetitions for each single shape in the associative condition. In the second part (bottom), participants were asked to choose which of two shapes they prefer, where one of those shapes had previously been associated with other shapes, and the other had only occurred in random groupings.
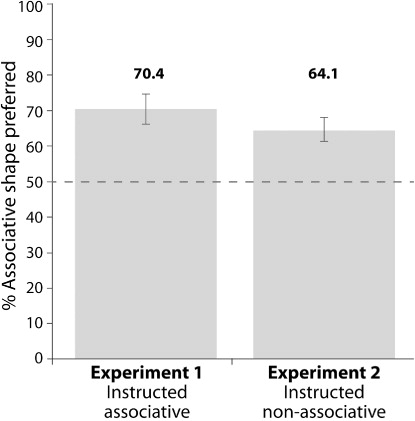
Figure 2 Results for the preference judgement task. The left bar shows the data from Experiment 1, in which participants were instructed to detect regularly associated shapes in the initial learning task. The right bar shows data from Experiment 2, in which participants were instead instructed to detect novel shape configurations during the learning task. After the learning task, subjects in both experiments were asked to choose which of two presented shapes they preferred: one of those shapes had been repeatedly associated with other shapes (in consistent groupings) in the preceding learning task, and the other had only occurred in random groupings. The bars show the overall preference for shapes that have been repeatedly associated with others. The dotted line represents choices based on indifference (50%). Error bars represent standard errors of the mean.
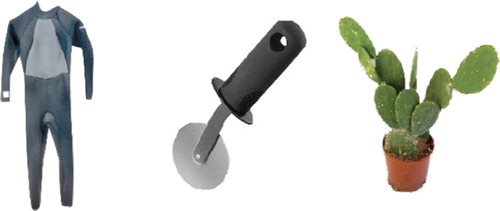
Figure 3 Example stimuli for Experiment 3, one representative image per condition. Left: Associative-Many, middle: Associative-Few, right: Weakly-Associative.