Figures & data
Table 1. Percentages or means (Standard Deviations) on demographic and assessment measures including baseline group comparisons.
Figure 1. Schematic overview of the experiment. Studies 1 and 2 were identical. Pairs consisted of Swahili cues and English translations as targets with positive, neutral, or negative meaning.
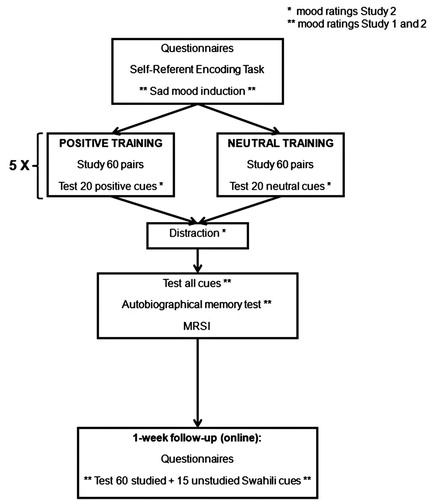
Figure 2. Negative and positive mood ratings throughout the two study sessions, presented separately for Study 1 and Study 2. Error bars represent one SE
Note: S1 refers to Session 1, S2 refers to Session 2.
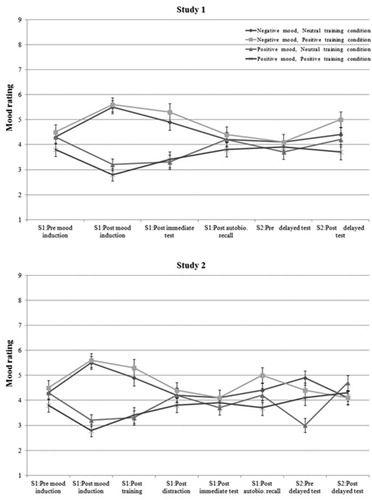
Figure 3. Number of translations recalled on the immediate and the delayed test in Study 1 and Study 2. Error bars represent one SE.
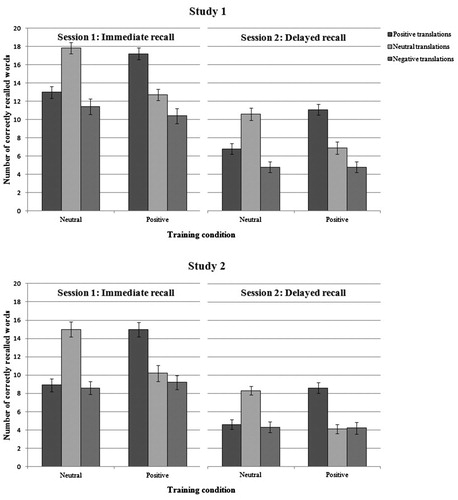
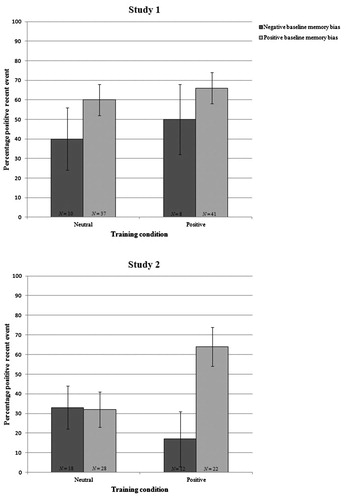
Figure 4. Valence of recent event in autobiographical memory test depending on bias at baseline and condition, presented separately for Study 1 and Study 2. Error bars represent one SE.