
Figures & data
Figure 1. Acquisition and test phase trial sequence.
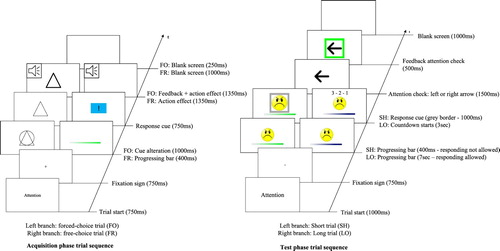
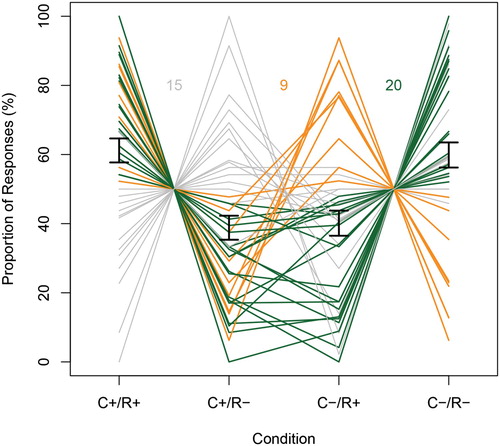
Figure 2. Probability of executing actions per condition. Thick black lines indicate the means and the standard errors per condition. Thin green lines show mean responses of participants (N = 20) who responded in line with the TEC hypothesis (C+R+ > C+R− and C−R+ < C−R−). Thin orange lines (N = 9) show mean responses of participants who preferred performing actions with positive outcomes (C+R+ > C+R− and C−R+ > C−R−). Thin grey lines show mean responses of the remaining participants (N = 15). See online version of this Figure for the colour version. C+ = positive cue. C− = negative cue. R+ = response with learned positive outcome. R− = response with learned negative outcome.
Supplemental material